These two different situations are dealt with by two different methods:
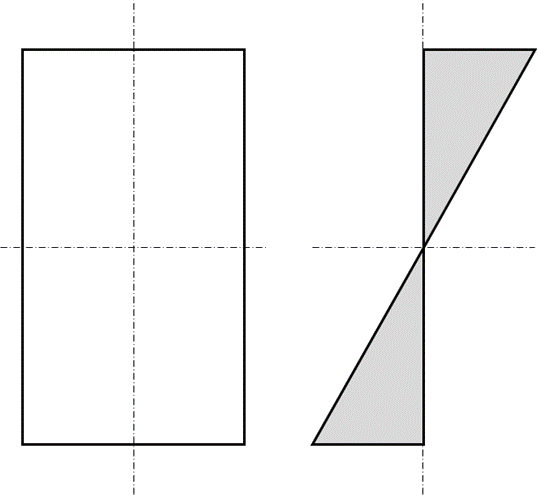
The classic bending hand analysis (or linear finite analysis) assumes a linear distribution of bending stress and strain through the thickness. Considering a rectangular section:
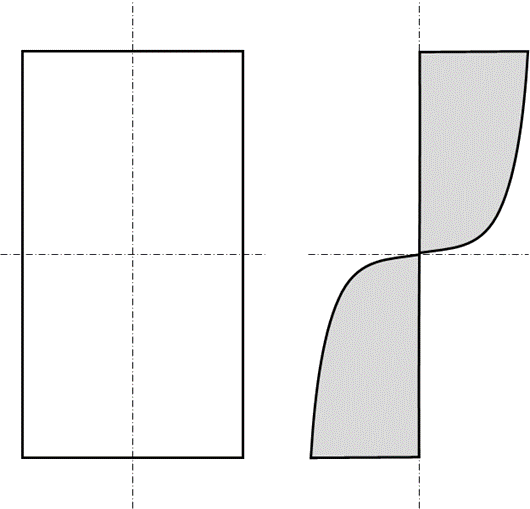
For ductile materials, almost all metals, stress and strain are not linear up to the point of failure. As the proportional limit is exceeded the young’s modulus of the material reduces. As the peak stress regions at the surface of the bending member exceed yield, the strain and the stress does not increase at the same rate. The outer fiber does not reach ultimate strength until material closer to the neutral axis sees an increased level of stress.
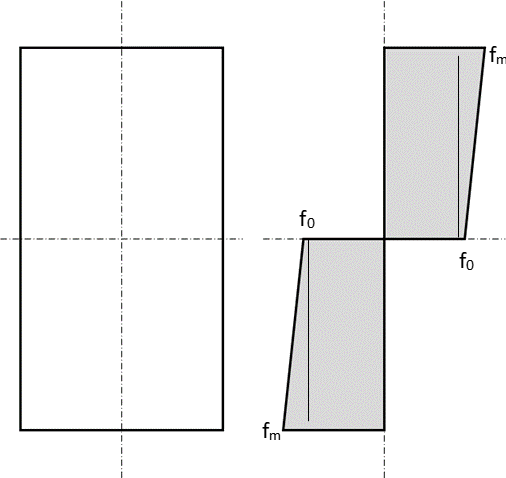
The plastic stress distribution can be approximated with the following stress distribution:
 NASA TM X-73305, 1975)
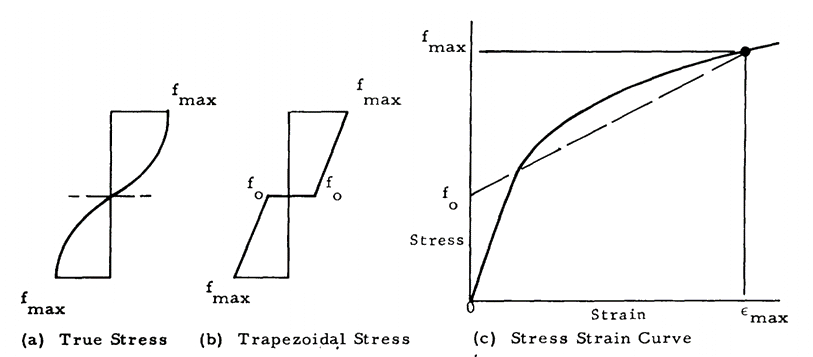
 fm can be assumed to be equal to the ultimate strength (Ftu) of the material. From Section 4.2.2.1 the stress-strain curve can be modelled in the following way:
f0 is the fictional stress which is assumed to exist at the neutral axis or at zero strain. The value of f0 is determined by making the requirement that the internal moment of the true stress variation must equal the moment of the assumed trapezoidal stress variation.
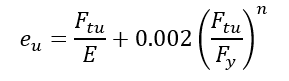
The total strain at failure can be expressed as the elastic strain added to the plastic strain. This is called the Ramberg-Osgood relationship (![]() MIL-HNDBK-5H, 1998) Section 9.3.2.4 and (
MIL-HNDBK-5H, 1998) Section 9.3.2.4 and (![]() NACA-TN-902, 1943):
NACA-TN-902, 1943):
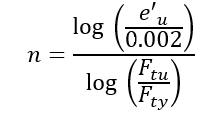
The Ramberg-Osgood shape factor can be derived using the following relationship:
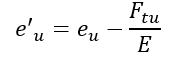
Where the plastic component of the total strain at failure is given by:
The ratio between f0 and a reference stress level fm is given by the following expression:
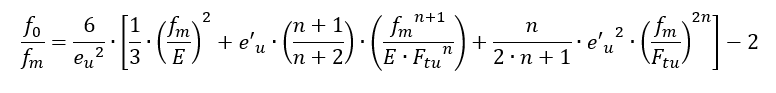
When fm is set to Ftu, the f0 for ultimate plastic material strength can be found.
Once f0 has been found it can be used in the following expression to give the value of the ultimate bending strength:
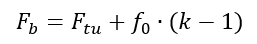
Where Fb is the ultimate bending strength and k is a factor between 1.0 and 2.0 that depends on the geometry of the cross section.
A spreadsheet of this analysis method is given at the link below:
Note that in some references K (capital ‘k’) = k – 1 (lowercase ‘k’)
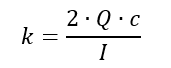
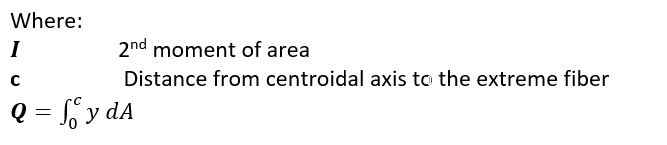
The shape factor k (lowercase) is calculated by dividing the plastic section modulus by the elastic section modulus. This can also be expressed as:
The shape factor calculations methods for common shapes is now included in Section 6 of this book.
The following spreadsheet calculates ‘k’ for common cross sections:
The following spreadsheet calculates shape factor, ‘k’, of compound sections made up of rectangles as well as basic section properties: