Metallic material properties suitable for certified aircraft use have been long established. The public domain (![]() MIL-HNDBK-5H, 1998) has been superseded by the commercial MMPDS document, however, the (
MIL-HNDBK-5H, 1998) has been superseded by the commercial MMPDS document, however, the (![]() MIL-HNDBK-5H, 1998) is still relevant and an excellent resource.
MIL-HNDBK-5H, 1998) is still relevant and an excellent resource.
This section regarding basic metallic material properties is largely taken from section 1 of (![]() MIL-HNDBK-5H, 1998).
MIL-HNDBK-5H, 1998).
The two most common material types used in aircraft construction are steel and aluminum. With steel being used sparingly for specific high strength, high endurance or high-temperature applications because of its relatively high density (approx. 3 times that of aluminum).
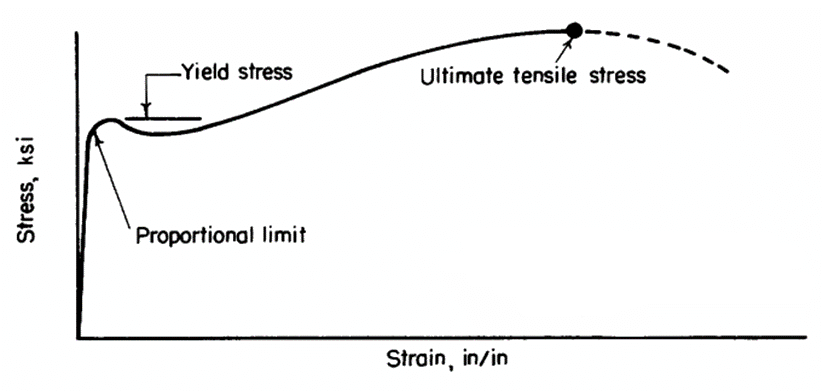
4.2.2.1. Stress-Strain Curves
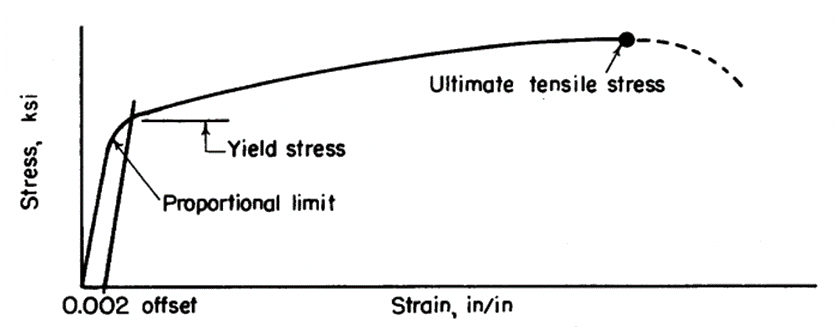
Both steels and aluminum exhibit plastic behavior but in slightly different ways.
 MIL-HNDBK-5H, 1998)
 Steels will typically have a defined yield point on the stress/strain curve and aluminum will generally have a smoother curve.
 MIL-HNDBK-5H, 1998)
 The Stress-Strain curve can be modeled with a simple close approximation, this is called the Ramberg-Osgood method and is defined in (![]() NACA-TN-902, 1943). An adaptation of the Ramberg-Osgood approach is defined in section 1.6 of (
NACA-TN-902, 1943). An adaptation of the Ramberg-Osgood approach is defined in section 1.6 of (![]() MIL-HNDBK-5H, 1998) and (
MIL-HNDBK-5H, 1998) and (![]() NACA-TN-927, 1944). Having a simple method for modeling the stress-strain behavior of a material proves to be extremely useful when an accurate picture of how a feature may behave beyond the material yield point is required.
NACA-TN-927, 1944). Having a simple method for modeling the stress-strain behavior of a material proves to be extremely useful when an accurate picture of how a feature may behave beyond the material yield point is required.
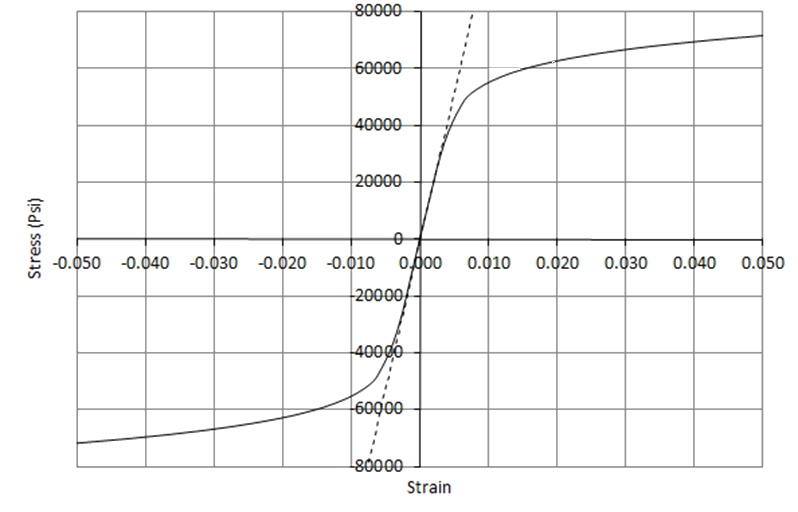
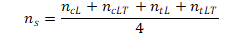
The model of the stress-strain curve is predicated on the following relationship:

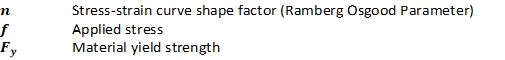
Where:

And:
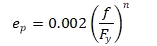
i.e. the total strain is the sum of the elastic and plastic strains. This can be re-written:
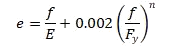
Where:
The lower the value of n, the more gradual the transition between the elastic and plastic regions of the curve. For higher values of n the transition is more abrupt. Metals with low values of n usually have a lower yield strength relative to their ultimate strength.
 MIL-HNDBK-5H, 1998) showing Varying ‘n’ for Different Grain Directions and Load Direction
 (![]() MIL-HNDBK-5H, 1998) notes this about the shape factor ‘n’:
MIL-HNDBK-5H, 1998) notes this about the shape factor ‘n’:
“While this relationship may not be exact, it is sufficiently accurate for use up to the yield strength for many materials but cannot be employed to compute full-range stress-strain curves.”
An approximate method for calculating the shape factor in the plastic region can be derived from the approach in (![]() MIL-HNDBK-5H, 1998):
MIL-HNDBK-5H, 1998):
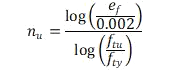
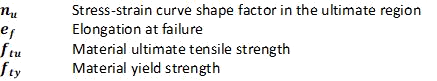
Where:
It is recommended that the ultimate shape factor is used above fty . When plotting full range stress train curves a smoothing function can be used to avoid an unnatural step in the value of ‘n’.
Note that this method produces only an approximation of the shape of the true stress-strain curve of the material being examined. For the purpose of analysis, this approximation can be assumed to be accurate.
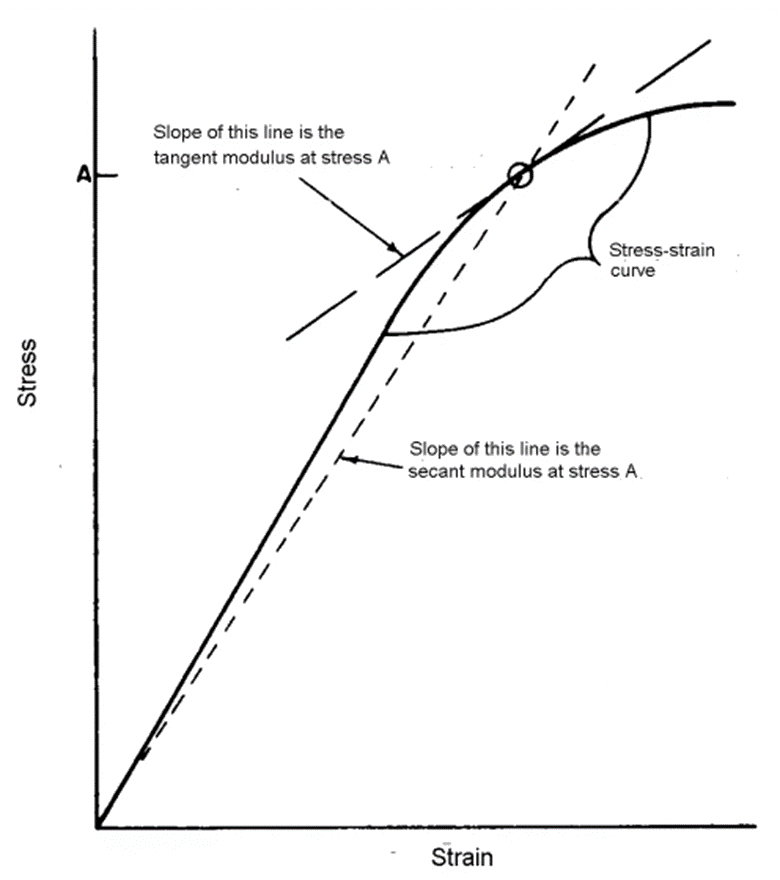
Different measures of the nonlinear nature of the stress-strain curve are useful and used in the correction of buckling allowable stresses for plastic effects. The two most commonly used are the tangent modulus and the secant modulus.
 MIL-HNDBK-5H, 1998)
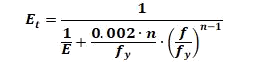
 The tangent modulus is given by the following expression:
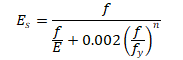
The secant modulus is given by the following expression:
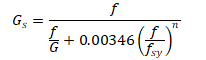
The secant shear modulus is given by the following expression:
A material property that is commonly missing from the certified, public domain material data is the shear yield strength. An approximation can be made for this value using the following expression:

An acceptable approximation for the shear shape factor is:
We have created a spreadsheet that constructs the elasto-plastic material curves from basic material properties.
4.2.2.2. Grain Direction
While metals are generally isotropic in behavior they do show differences in static strength and, more significantly, in fracture toughness depending on the form of the metal and the direction.
Raw material is most commonly procured in sheet, panel or bar stock or as an extrusion of a specific shape.
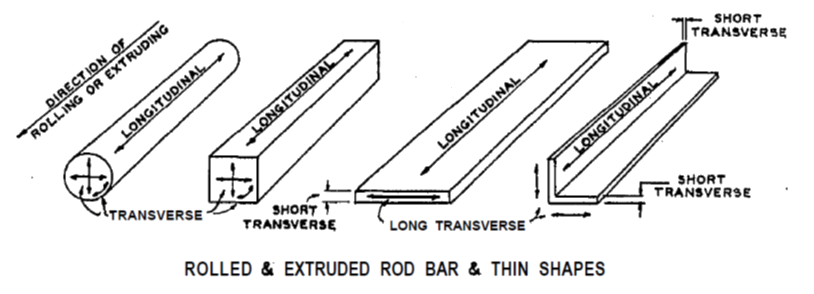
Sheet is relatively thin; Panel is relatively thick. Bar stock is rolled with a circular cross section and extruded stock is pressed through a die with a particular cross section.
Grain direction is determined by the mill’s rolling process which forms and stretches the microscopic structure and inclusions of the material. The grain direction runs parallel to the rolling direction.
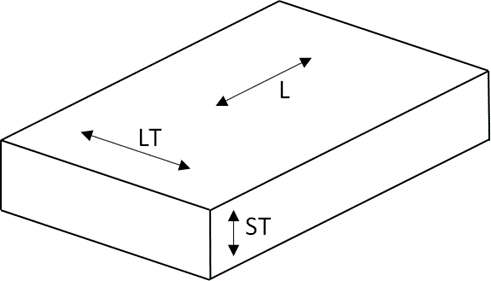
For sheet or Panel stock the different directions through the raw material are defined as follows:
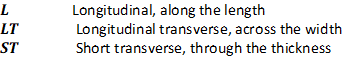
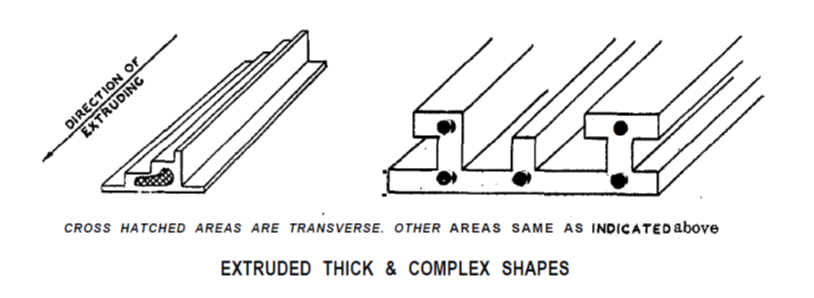
It is advised not to align lug features in the short transverse grain direction for fittings machined from thick billets. This arrangement will show poor fatigue characteristics.
The short transverse grain direction is also more likely to demonstrate poor stress corrosion characteristics. See section 4.4.7.
Definitions of grain direction for common metallic forms are shown below:
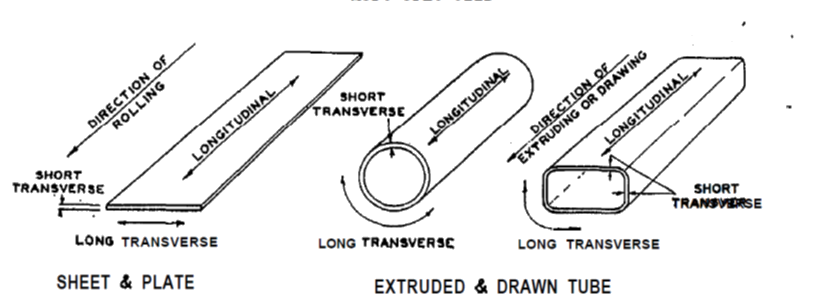
 MSFC-SPEC-522B, 1987)