A New Way to Help the Technical Library

We are very grateful to the people who have donated to the technical library over the years. The cost to keep it going is significant and we appreciate every contribution no matter how small.
However, donating is difficult as you are making a cash gift for nothing tangible in return (OK, you get some stuff from the website, but there is a tenuous physical relationship there….)
In order to make it easier for people to support the technical library we have moved from asking for donations to selling engineering related products. You can see what we have on offer here.
Our intent is to make the designs relevant to engineers, unique and amusing where we can.
I have ordered some of the products as samples and I am happy with the quality and the value and am going to treat myself to a number of the ‘bad patent’ t-shirts and sweaters.
We will be updating the range of merchandise and the designs so please do check out the store on a regular basis and if you can make your engineering colleagues and friends aware I am sure they will find something that will amuse and delight them.
A Negative Lesson in Leadership

Some things have happened in the UK. We have had a change of government. The previous government was painfully inept and grossly corrupt. It is no surprise that they were voted out. The new government has a very low bar that governs the appearance of competence. In a surprising turn of events they are doing their best to cram themselves underneath it.
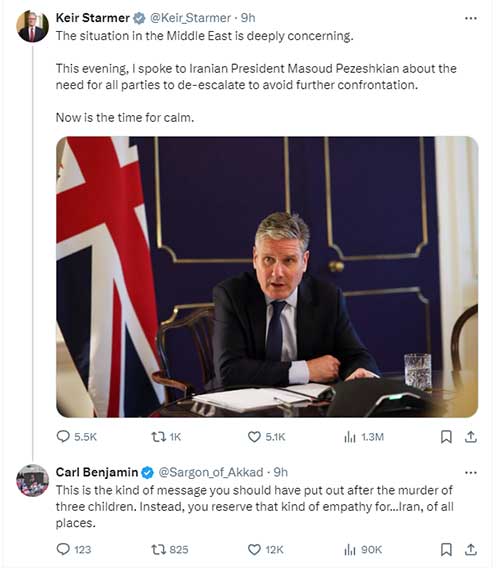
I will not comment on the events in the UK of the last few weeks, but this screenshot from Twitter shows a tangible result of the new Prime Minister’s demonstration of competence.
The Prime Minister, Kier Starmer put out a tweet that he has appealed to the leader of Iran to ‘de-escalate’. I think it would be better if he clearly voiced his concern that Iran has been directly attacking Israel as well as using their political clients, Hamas, Hezbollah, and the Houthis to attack Israel and any allied interests and assets in the region.
Now is not the time for calm per se. Now is the time to stop the actions that are intended to foment a war with Israel to wipe Israel off the map, unless you want a regional and possibly wider war.
I am not making a moral judgment on this or taking sides, it is just bleeding obvious that this is what Iran wants because this is what they have been saying openly, planning for, and executing for decades.
This tweet, at the time of viewing, has1.3M views, 5.1K likes, and 5.5K comments. Getting more comments than likes (for those unfamiliar with X/Twitter parlance) is called being ‘ratioed’ – this is an unpopular post. This has a like-to-view ratio of 0.4%.
The reply, by the reprehensible and scurrilous right-wing firebrand (if you believe our utterly untrustworthy UK press) Carl Benjamin has 90K views and 12K likes. This has more absolute likes than the tweet from the prime minister and a like-to-view ratio of 13.0%.
Mr. Starmer has made a series of bad decisions since taking office, he has engaged in the most extreme gaslighting and psyops on the public since COVID. The main stream media at one point were all using the same photograph and the same headline on the same day – a demonstration of overt media manipulation and central coordination.
He failed to recall parliament from recess and decided that the best course of action was a solution based around race-baiting demonization, appalling and obvious two-tier application of police powers and the legal system while telling everyone not to believe their lying eyes and informing us it was dangerous to point out the obvious. Dangerous to whom or what?
Kier has an enormous parliamentary majority based on the votes of a small fraction of the electorate (about 20% of those eligible to vote).
I don’t know how intelligent he is, but he appears to lack awareness of his deep unpopularity even before he took office. He is also unaware of the widespread lack of trust in both the mainstream media and the police and foolishly has elected to rely on them both to lend himself credibility. Akin to getting a reference for a childminder job from Jeffery Epstein.
(The UK has the lowest amount of trust in Media out of any country surveyed:
https://pressgazette.co.uk/media-audience-and-business-data/trust-in-media-uk-edelman-barometer-2024
and only 40% of the country trust the police
I am sure the recent events have reduced these even further).
Kier has so far demonstrated a critical lack of awareness of his tenuous position and the mood of the country. Many people who did not vote for him (the vast majority) were willing to give him a chance. He has driven a bulldozer through his honeymoon period and is almost certainly destined to be the most unpopular leader this country has had.
As has been pointed out by others, the problem with Brexit was that we restored the power to govern the country to a bureaucracy and a political class that is not only unfit for purpose but demonstrates an unnerving talent for f*cking things up at every opportunity. At least the EU aggregates the corruption and stupidity across a wider region so it is less glaringly obvious.