4.1.6.1. Definition of Laminate Plane Element Behavior
The Strength of any structure can be determined by two means – analysis or test. The purpose of the analysis is to predict performance in real life. Real-life performance is reliably predicted by accurate testing.
There are some excellent public domain primers for analysis of composites including section 4 of ( MIL-HDBK-17F Vol 3, 2002).
This section is largely based on (NASA-RP-1351, 1994). The author recommends that this document is reviewed separately by the reader. The material presented here is a summary of the reference material.
Most of the existing references concentrate on the classic laminate method which is the underlying physical model behind most analysis methods.
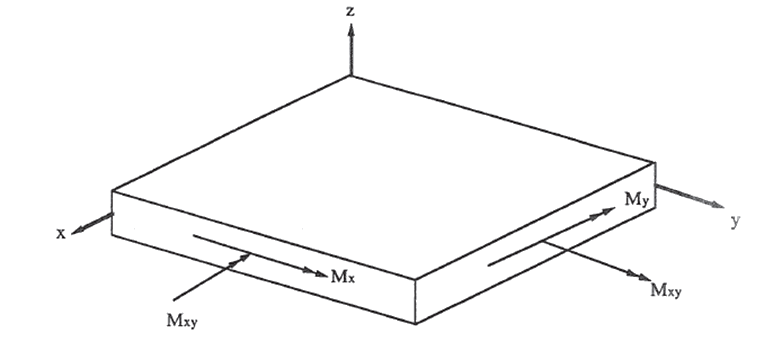
The aim of this analysis method is to distil the physical characteristics of the laminate to a standard method of describing the stiffness of a panel – i.e. an idealized 2D element – this form of stiffness description is called the ABD matrix and expressed in the following form:
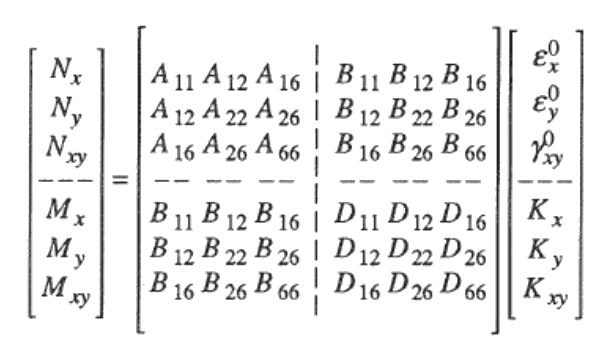
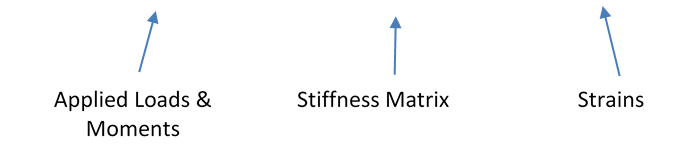
Figure 4.1.6‑1: ABD Matrix Equation for Plane Laminate Element (NASA-RP-1351, 1994)
The inverted form of the matrix can be used to find the strains resulting from applied loads and moments.
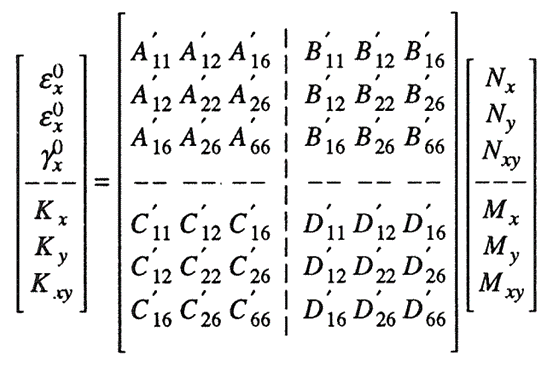
Figure 4.1.6‑2: Inverted ABD Matrix Equation for Plane Laminate Element (NASA-RP-1351, 1994)
Where:
N are loads, M are moments (expressed in flow, or load/moment per unit length), ε are strains and K are curvatures. Aij represents extensional and shear stiffnesses, Bij represent extension-bending coupling stiffnesses and Dij represent bending and torsional stiffnesses.
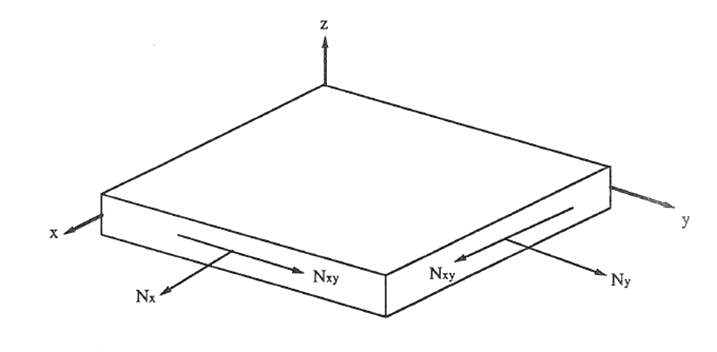
The applied loads and moment flows are defined as follows:
A good explanation of the stiffness matrix terms is given in (MIL-HDBK-17F Vol 3, 2002):
The stiffness matrix Aij in Equation 4.3.2(n) is independent of LSS (Laminate Staking System). Inversion of the stiffness matrix [ABD] yields the compliance matrix [A’B’D’]. This inversion is necessary in order to calculate strains and curvatures in terms of loads and moments. The inversion results in a relationship between LSS and extension/shear compliances. However, this relationship is eliminated if the laminate is symmetric.
Nonzero values of A16 and A26 indicates that there is extension/shear coupling (e.g., longitudinal loads will result in both extensional and shear strains). If a laminate is balanced A16 and A26 become zero, eliminating extension/shear coupling.
Nonzero values of Bij indicates that there is coupling between bending/twisting curvatures and extension/shear loads. Traditionally, these couplings have been suppressed for most applications by choosing an LSS that minimizes the values of Bij. All values of Bij become zero for symmetric laminates. Reasons for designing with symmetric laminates include structural dimensional stability requirements (e.g., buckling, environmental warping), compatibility of structural components at joints and the inability to test for strength allowables of specimens that have significant values of Bij.In general, the values of Dij are nonzero and strongly dependent on LSS. The average Panel bending stiffnesses, torsional rigidity and flexural Poisson’s ratio can be calculated per unit width using components of the compliance matrix [A’B’D’].
1/D’11 = bending stiffness about y-axis
1/D’22 = bending stiffness about x-axis
1/D’66 = torsional rigidity about x- or y-axis
-D’12/D’11 = flexural Poisson’s ratio
The D’16 and D’26 terms should also be included in calculations relating midplane curvatures to moments except when considering a special class of balanced, unsymmetric laminates.
Nonzero values of D16 and D26 indicates that there is bending/twisting coupling. These terms will vanish only if a laminate is balanced and if, for each ply oriented at +θ above the laminate midplane, there is an identical ply (in material and thickness) oriented at -θ at an equal distance below the midplane. Such a laminate cannot be symmetric, unless it contains only 0o and 90o plies. Bending/twisting coupling can be minimized by alternating the location of +θ and -θ plies through the LSS.
The ABD matrix equation can be inverted and solved for strain for a given set of loads and moments as shown in Figure 4.1.6‑2.
Basic laminate stiffness’s (ABD matrix values) can be calculated with the following spreadsheet:
Once the ABD stiffness matrix is defined the principal strains can be calculated with this spreadsheet.
4.1.6.2. Measuring Laminate Strength
The measured strength of composite laminate and how it is compared with failure criteria is a bone of contention. A wide variety of opinion exists as to the best and most accurate way to analyze composite structures.
The aim of any analysis is to identify the load at which the structure fails, the location of failure and the mode of failure.
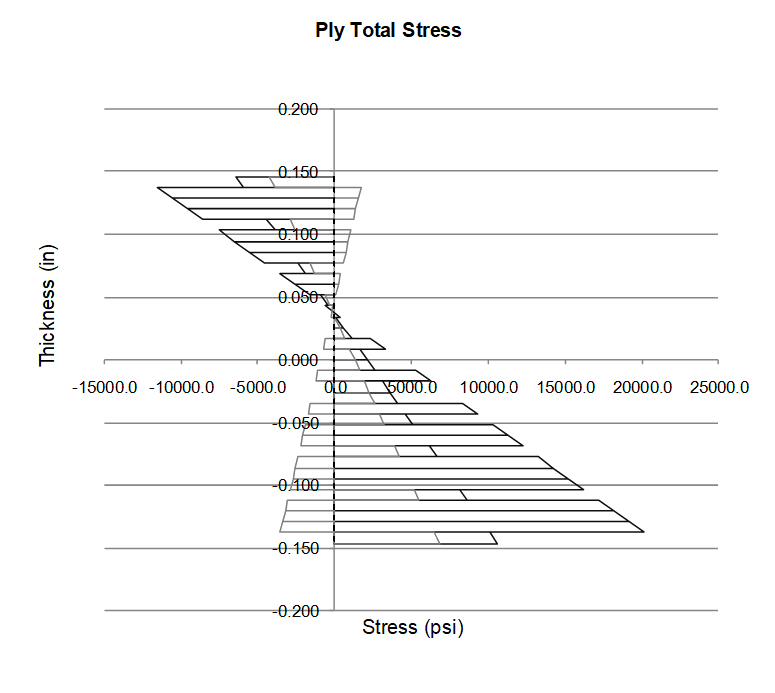
There are two different approaches to fiber laminate stress analysis, one is to consider each ply within the laminate and develop a failure index (common methods are Tsai-Wu or Hill) for each ply within the laminate, this is called the lamina stress approach. The failure of a single ply causing a sudden internal load redistribution that will cause the laminate to fail. This is a stress based approach where the load applied to a particular laminate has to be distributed onto each ply across the laminate thickness taking the direction of load in relation to the ply orientations into account. This produces a plot of stresses on each ply through the thickness that looks like this:
The following spreadsheet calculates the individual stress in each ply of a laminate and margins of safety based on a range of failure indices.
A margin of safety can then be generated for each ply; the full Tsai-Wu failure criteria formulation is as follows:

While this appears complex, multiple Tsai-Wu checks on each ply in the laminate, per analysis location can easily be managed through spreadsheets or finite element post processors.
The ‘ply–by-ply’ stress failure approach is not commonly used in aircraft structure sizing and analysis. This is because it is difficult to correlate the actual failure of damaged composite laminates to an individual ply stress failure criterion.
The second analysis approach which is more commonly used for airframe primary structure is the laminate strain approach. In this method, the peak laminate strain is determined by analysis and compared with a strain allowable for a specific laminate configuration determined by test.
Classical laminate theory, the same theory that is used to distribute the loads and moments into each ply for the ply-by-ply stress analysis approach, assumes that the strain in the laminate maintains a smooth, linear distribution. There is a necessity for the laminate to operate as a coherent cross-section when reacting load. A step change in strain at a point across the thickness implies an inter-laminar failure.
Most companies developing composite structure for primary airframe applications use the strain approach. This is because testing can be done to develop laminate strain allowables that take account of manufacturing flaws and in-service damage. This is necessary to show compliance with FAR 23.573 and 25.573.
In primary structure, the level of stress raiser that is used for composite analysis is dictated by the aircraft certification regulations and has been accepted as impact damage up to the ‘BVID’ (Barely Visible Damage) level. The certifiable strength of laminate for the primary structure is usually derived using ‘compression after impact’ testing.
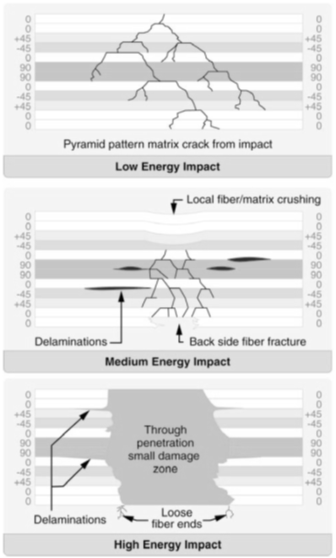
Figure 4.1.6‑5: Impact Energy Levels and Relative Visibility (FAA-H-8083-25A, 2008)
Nonvisible, or BVID, or defects that are not detectable during manufacturing inspections and service inspections must withstand ultimate load and not impair operation of the aircraft for its lifetime. (DOT/FAA/AR-02/121, 2003)
Note that non-visible impacts can still cause damage through the thickness of the laminate, reference Figure 4.1.6‑5. This level of damage must be able to withstand ultimate load.
The realistic test assessment of impact damage requires proper consideration of the structural details and boundary conditions. When using a visual inspection procedure, the likely impact damage at the threshold of reliable detection has been called barely visible impact damage (BVID). Selection of impact sites for static strength substantiation should consider the criticality of the local structural detail, and the ability to inspect a location. The size and shape of impactors used for static strength substantiation should be consistent with likely impact damage scenarios that may go undetected for the life of an aircraft. (AC20-107B, 2009)
To determine BVID laminate strength, a standard panel size is impacted with steel impactors of typical geometry (derived from the items in manufacture and service that are most likely to be the source of damage – tools, hail, etc) up to the point where the damage is just visibly detectable (there are established criteria for visibility of damage), these panels are then placed in a test fixture and compression load applied up to failure. The resulting compression strength is the basis for the material strength used in the structural substantiation. This type of testing is called ‘Compression After Impact’ testing or CAI.
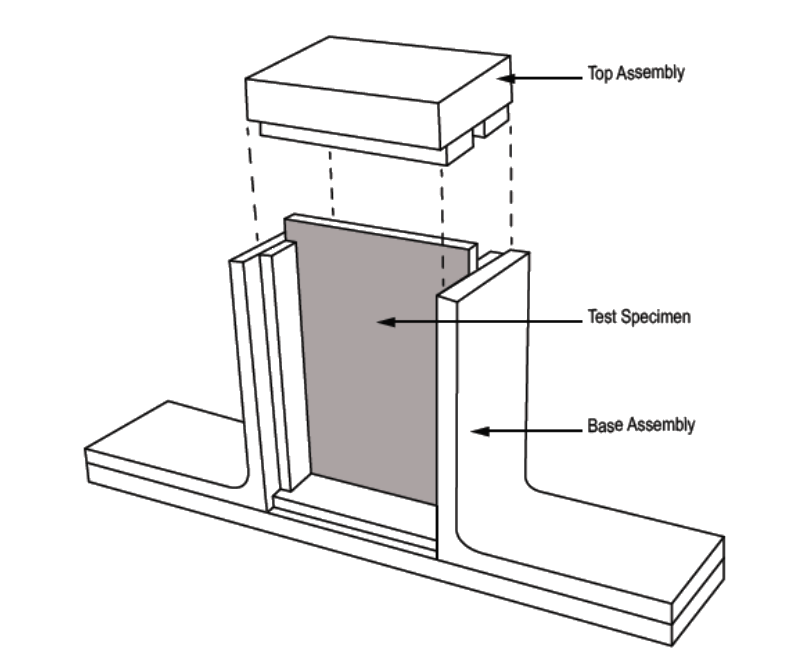
Figure 4.1.6‑6: CAI Test Fixture (NASA/TP-2011-216460, 2011)
The strength of any structure in a non-pristine condition is referred to as ‘Residual Strength’. Composite laminate structure is brittle compared to metallic structure (no plasticity) and therefore damage, flaws and other stress/strain raising features must be accounted for in the static analysis in ways that are not considered in the static analysis of metal structure.
During the certification process, different levels of damage to the airframe are examined and the residual strength determined. This is, in part, the reason for adopting the ‘pyramid’ or ‘building block’ approach to structures substantiation through test, analysis and correlation between the two.
The aircraft developer (the applicant for the type certificate) must demonstrate an adequate level of understanding regarding strength and durability of their chosen material and the results of their processing (storage, handling, layup, cure, etc) and quality system when combined with the features within the airframe.
The progressive building block approach is taken to allow the developer to recognize potential issues and mitigate those issues at the earliest possible stage in the product development process.
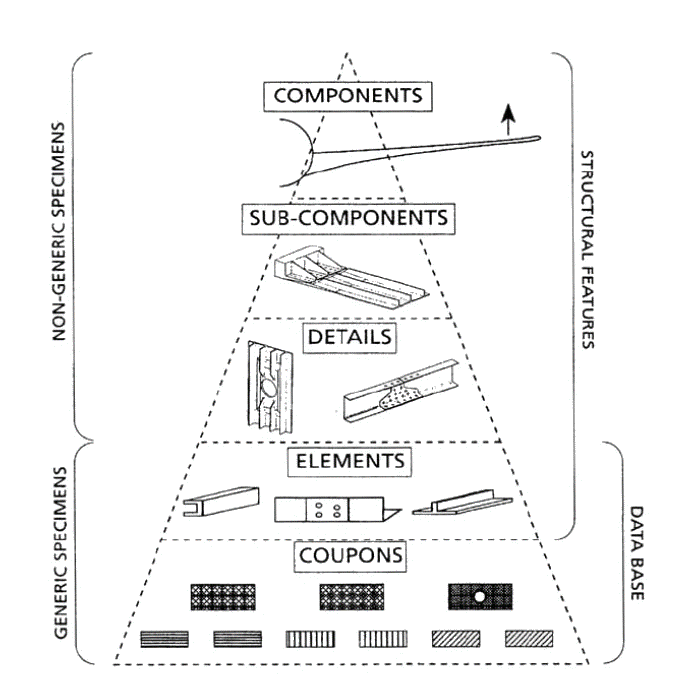
Figure 4.1.6‑9: Schematic Diagram of Design Load Levels versus Categories of Damage Severity (AC20-107B, 2009)
Most of the analysis that is done is at ultimate level for BVID damage and uses strain limits developed by CAI testing or other testing to demonstrate the residual compression strength of the structure.
CAI strength values are usually the most conservative allowable values considering common features and flaws in the laminate. (See Figure 4.1.6‑10). If the laminate is designed using CAI strength values, the analysis will demonstrate adequate strength for all less critical features and flaws. This can significantly simplify the structures analysis, but will provide a heavier and more robust design than an alternative method.
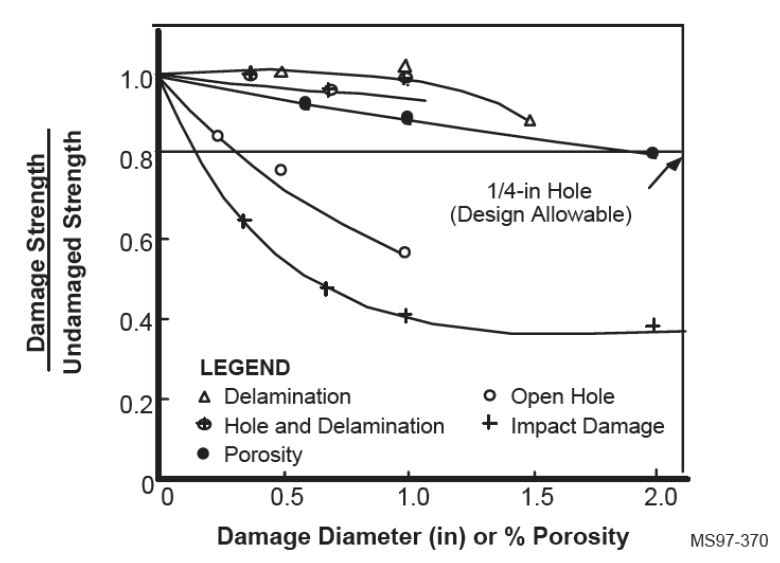
Figure 4.1.6‑10: Comparison of Impact on Strength of Different Laminate Flaws and Features (NASA-NAS1-19347, 1997)
Figure 4.1.6‑10 shows that of all the features, flaws and events; impact damage is critical. The critical measure of strength for fiber laminates is compression since this mode of failure is dominated by the strength of the matrix. This is the reason why compression after impact (CAI) testing is used as a basic laminate strength metric, it is a combination of the critical loading mode with the critical condition of the laminate. In general, all other loading modes and features can be passed by comparison.
Some good general data for quasi-isotropic carbon laminates is given in (MIL-HDBK-17F Vol 3, 2002) Section 4.11.2. Where a representative relationship between CAI strength and damage size and impact energy is shown graphically:
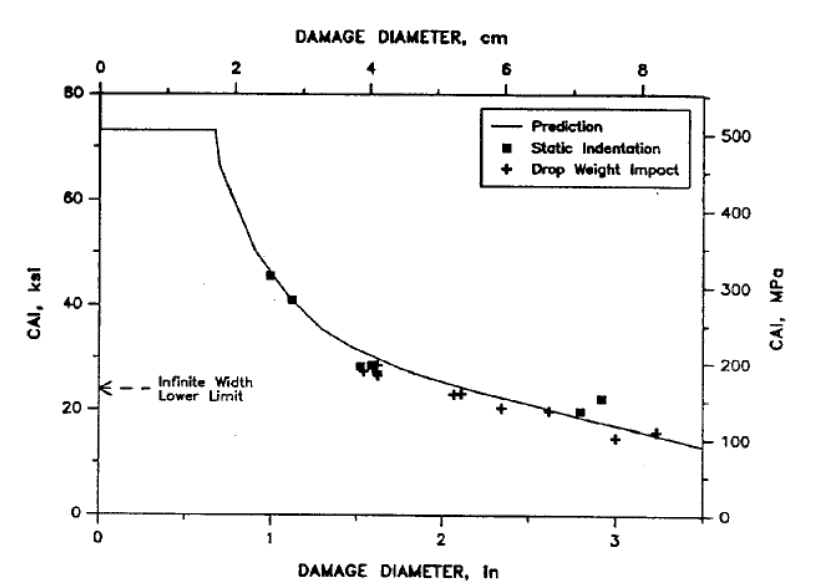
Figure 4.1.6‑11: Residual Strength (expressed as failure stress) for Increasing Damage Size (MIL-HDBK-17F Vol 3, 2002)
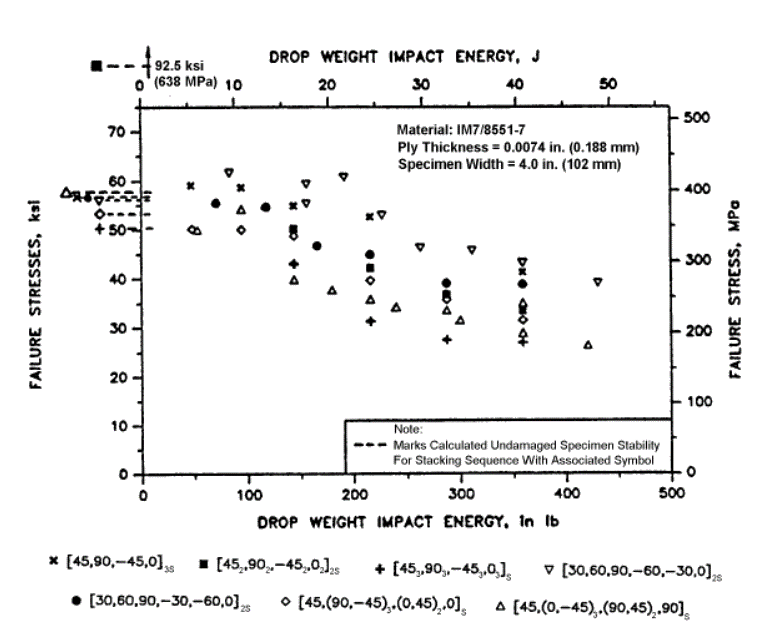
Figure 4.1.6‑12: Residual Strength (expressed as failure strain) for Increasing Impact Energy (MIL-HDBK-17F Vol 3, 2002)
It is worth noting that in a previous study the author has found for one material system that an ETW (Extended Temperature Wet) CAI strain limit of 3200με for quasi-isotropic carbon fiber (epoxy resin infused) was equivalent to a von Mises stress level of approximately 25ksi for an isotropic material with the same stiffness. This is in broad agreement with the CAI stress level from Figure 4.1.6‑11 for a 2in wide damaged region.
Another source gives CAI strength in terms of strain, this is in broad agreement with a CAI allowable of 3200με. This reference gives a lower value than 3200με. This diagram is for unwoven UD or tape product. Woven products generally show greater CAI strength values:
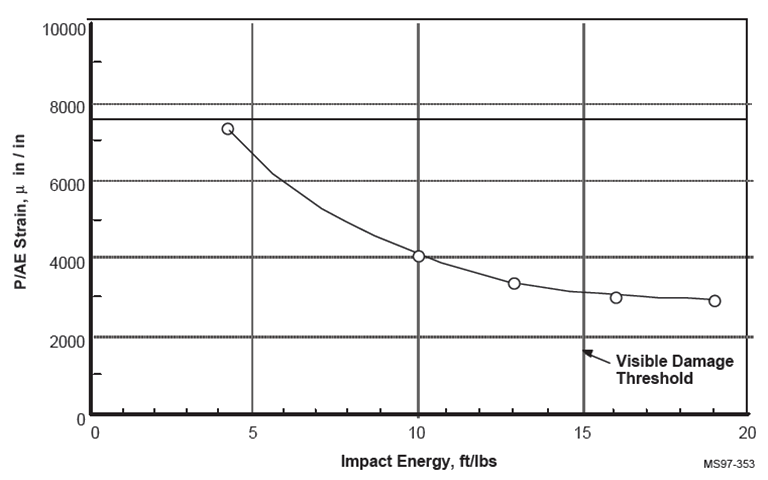
Figure 4.1.6‑13: CAI Strain Values for Varying Impact Energy Levels for UD Tape Laminate (NASA-NAS1-19347, 1997)
The size of impactor and the energy of the impact to create BVID is a function of a ‘Damage Scenario Document’ that is created by the composite structure OEM (Original Equipment Manufacturer) during the certification process. The purpose of this document is to examine the damage threat environment that the structure is exposed to through the complete lifecycle of the structure – from layup and cure to assembly and service. This document will list all potential types of damage the aircraft could experience.
These potential damage threats can be broken down into the following categories:
- Manufacturing
- Baggage handling
- Tire Fragments and stones from the landing gear
- Hail in flight
- Hail on the ground
- Damage around the door region
- Lightning strike
- Water intrusion
- Bleed air
- Rotorburst
- Engine fire
- Separation of aircraft components in flight
- Bird strike
These types of damage can occur at various levels of damage severity (refer to Figure 4.1.6‑9) and a single category of damage can potentially occur at any of the 3 levels (Ultimate Residual Strength Requirement, Limit Residual Strength Requirement or Continued Safe Flight).
Frequently Asked Questions
Why is laminate compression critical? Why not tension?
In compression, the composite laminate depends on the resin matrix for its strength. In tension, the load is taken by the fibers (assuming that the engineer has aligned sufficient fibers in the primary loading direction). The fiber is many times stronger than the resin matrix.
Damage progression/growth in matrix/fiber laminates is primarily through the matrix, not caused by breaking of the fibers.
How does using CAI (Compression After Impact) allowables help with damage growth under compression loads?
There is an established relationship between the ultimate CAI strength of laminates and the non-growth of damage at normal service level loads.
If the analyst uses CAI compression allowables for an ultimate level analysis the structure will not grow damage from a BVID impact for the life of the aircraft. Proving this relationship involves a significant amount of testing. (DOT/FAA/AR-10/6, 2011) gives some data that support this relationship. Caution is required in assuming that data for other aircraft and material systems are directly applicable to your situation.
Figure 4.1.6‑14 shows for the material considered and the fatigue spectra applied that at a limit load level in relationship to CAI (limit level = 1 / 1.5 = 0.667 or 66.7%) the structure can withstand over 100,000 cycles of limit level load. This is a significant level of robustness and can produce a structure that is not adequately optimized for weight.
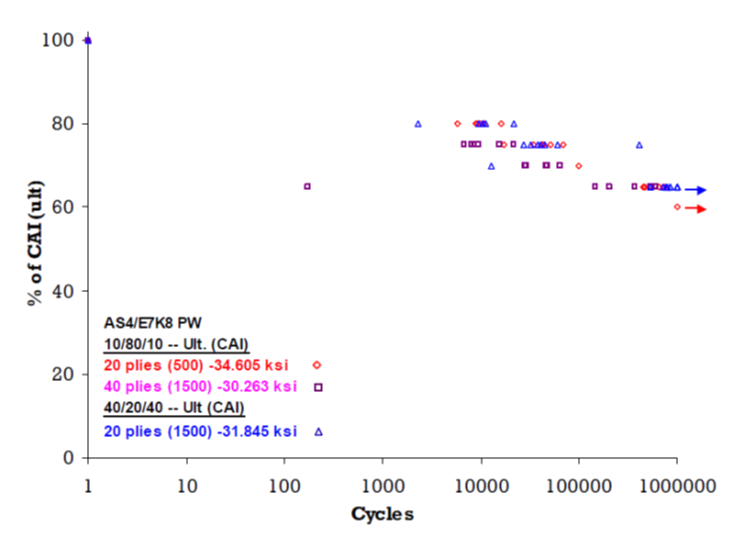
Figure 4.1.6‑14: Relationship between Fatigue Life and Compression After Impact, R = -1 (Cytec AS4/E7K8) (DOT/FAA/AR-10/6, 2011)
Laminate CAI allowables look low, are they too conservative?
Permissible laminate allowable can be greater than CAI – e.g. Open Hole Compression (OHC). The risk is solely carried by the aircraft developer taking this approach as the ‘no damage growth’ design philosophy must be proven during the certification process.
Open Hole (Open Hole Tension, OHT, and Open Hole Compression, OHC) is a less conservative measure of strength and durability and still has a significant level of robustness.
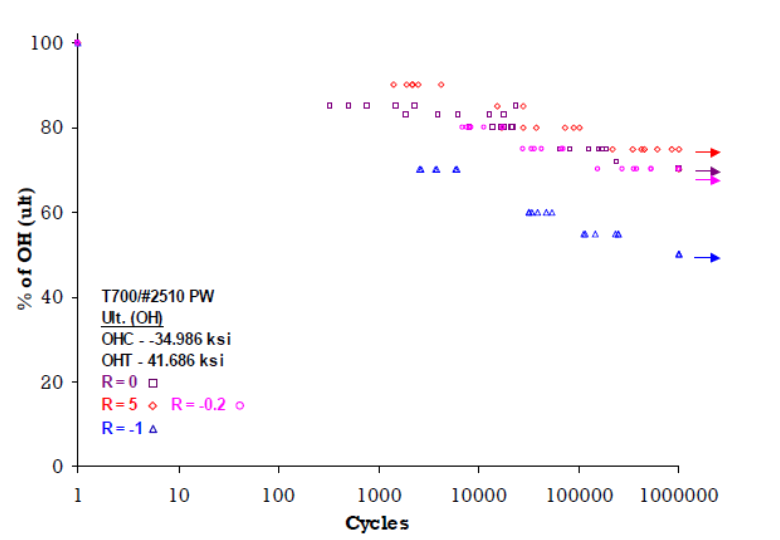
Figure 4.1.6‑15: Relationship between Fatigue Life and Open Hole (Toray T700SC-12K-50C/#2510) (DOT/FAA/AR-10/6, 2011)
Figure 4.1.6‑15 shows, for the material considered, the Open Hole sample could sustain a limit level fully reversible load for 10,000 to 20,000 cycles. Where the fatigue spectra is not fully reversed the fatigue life, for the parameters considered, is practically infinite.
4.1.6.3. Measuring the effect of Temperature on Composite Structure
Determining your Maximum Operating Temperature
You have to decide what your peak induced temperature in the airframe is likely to be – this is based on a lot of things – a review of the worst case environmental conditions out of (MIL-STD-210C, 1987) and other proprietary references, the color of the aircraft, the amount of glazing in the cockpit and cabin. You then choose a resin and a cure cycle that creates a wet glass transition temperature 50F above this peak induced temperature.
The actual guidance from the FAA is in document (FAA-PS-ACE100-2005-10038, 2005):
Reduction in strength properties at the maximum operating temperature (MOT) should be known for each application. The properties of polymer composite substrate and adhesive materials are affected by both temperature and moisture content, with a significant decrease in strength above the wet glass transition temperature(Tgwet). A simple guideline often used in selecting composite substrate materials is for the Tgwet to be 50 °F greater than the MOT of structural applications.
After you complete your aircraft temperature surveys you will find that the peak induced temperature for a white (or mostly white) aircraft is 180F. Airbus use 160F for their composites so the 180F value is not set in stone. But FAA policy statement (FAA-ACE100-2001-006, 2001) gives the following guidance regarding the 180F figure.
For most paint colors, a default critical structural temperature of 180F can be assumed without supporting tests or analyses. Dark colors or black, which may yield higher structural temperatures, are an exception.
If you want to use a MOT less than 180F you must do some justification to prove that this will be acceptable.
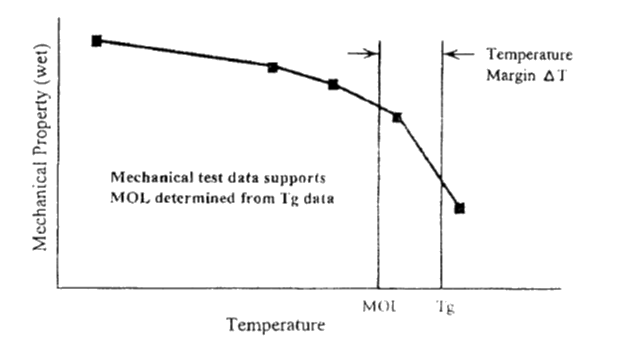
Figure 4.1.6‑16: Relationship Between Tg, MOT (MOL) and Mechanical Properties (Mil-HNDBK-17F-Vol1, 2002)
Glass Transition Temperature (Tg)
(Mil-HNDBK-17F-Vol1, 2002) describes glass transition temperature as:
Glass Transition – The reversible change in an amorphous polymer or in amorphous regions of a partially crystalline polymer from (or to) a viscous or rubbery condition to (or from) a hard and relatively brittle one.
Glass Transition Temperature — The approximate midpoint of the temperature range over which the glass transition takes place.
The most common way to measure glass transition temperature is by Dynamic Mechanical Analysis (DMA).
There are potentially multiple different values of glass transition temperature that could be derived from a DMA test.
The FAA allow the use of glass transition temperatures derived using a DMA test method per SACMA SRM-18R-94.
This method produces the following results.
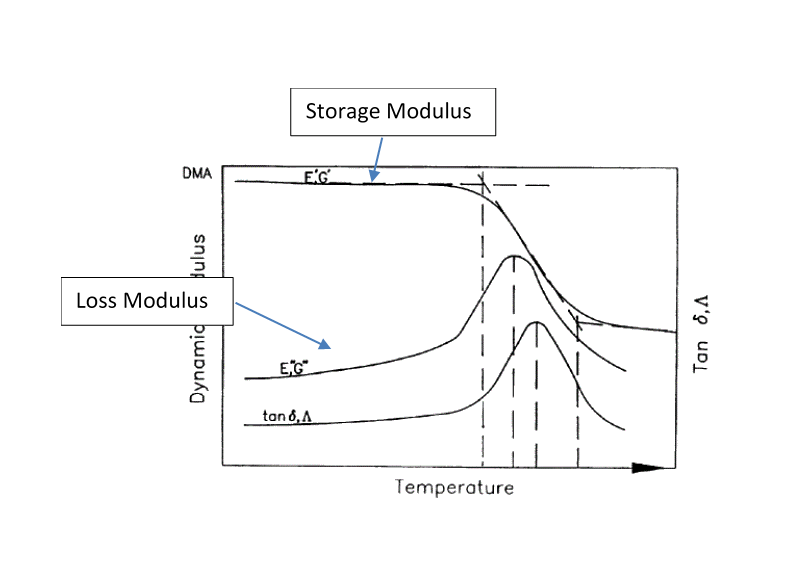
Figure 4.1.6‑17: Dynamic Mechanical Analysis (Mil-HNDBK-17F-Vol1, 2002)
It is possible to interpret the results so that the value where any of the dashed vertical lines intersect the x-axis could be the glass transition temperature.
SACMA SRM-18R-94 specifies a forced oscillation measurement at 1 Hz, a heating rate of 5C° (9F°) per minute, and calculation of an onset Tg from the dynamic storage modulus curve.
This value for glass transition temperature is the lowest from the figure above and is shown by the red line in the figure below:
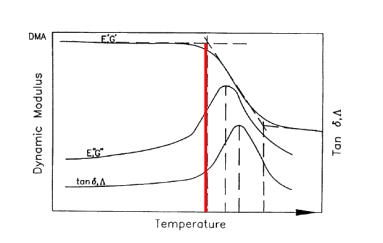
Figure 4.1.6‑18: Dynamic Mechanical Analysis, Tg at Storage Modulus Onset (Mil-HNDBK-17F-Vol1, 2002)
Post curing raises the glass transition temperature of a polymer and therefore raises the Maximum Operating Temperature.
Moisture lowers the glass transition temperature; hence the wet glass transition temperature is lower than the dry glass transition temperature.
4.1.6.4. Commonly Asked Questions
How do I take environmental conditions into account?
CAI or any residual strength compression testing is done at RT (Room Temperature) , CTD (Cold Temperature Dry), ET (Extended Temperature or ‘Hot’) and ETW (Extended Temperature Wet or ‘Hot Wet’) conditions in order to understand the effects of temperature and humidity conditions on the failure criteria. ETW will usually give the critical laminate allowable.
Do I have to do this for each different layup in the aircraft?
In theory yes, but it is normal to take a representative set of layups and materials that can be agreed to be generally applicable to the airframe. The minimum strain allowable of all the results can be used for initial sizing. The strain allowable for the local layup can be used later in the program when test results are available in order to reduce weight during detailed analysis.
What values can I use to get started when I have no test results?
WARNING: All values must be confirmed by test.
In general, for most carbon fiber composite laminates, whether UD tape, cloth or a combination of both; for ETW compression strain allowable values the following values can be used for initial sizing:
CAI: 3200με
OHC: 4000με
What do I use as a tension allowable?
It is normal to use ‘Filled Hole Tension’ (FHT) values for laminate tension values.
Typical value FHT: 5500 με
If carbon fiber composite laminates have no plasticity, then are the KT effects of the damages and features from the test panels included in the static analysis?
Yes – geometric or KT effects must be accounted for in composite laminate static stress analysis.
How do I use these allowable strain values?
See the next section.