Excel was created without consideration for authoring Letter or A4 page size reports in mind. Nevertheless, there are some useful tools built in that help you do this.
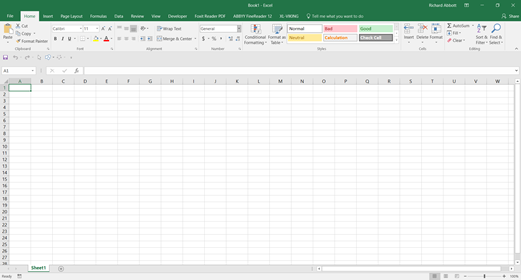
Figure 26.2.2‑1 above is what you see when you start excel. In the lower RH corner there are 3 icons.
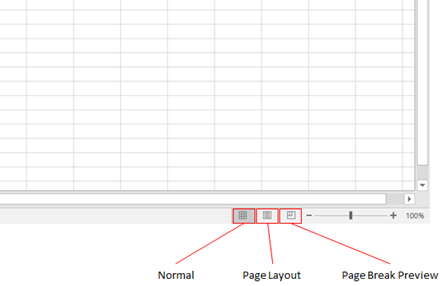
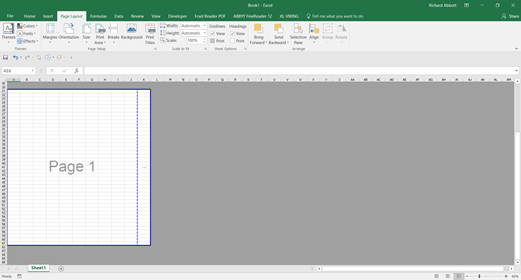
For the report sheets (More on the use of sheets later) we only work in Page Break Preview.
If you click that icon your screen will change and will look like this:
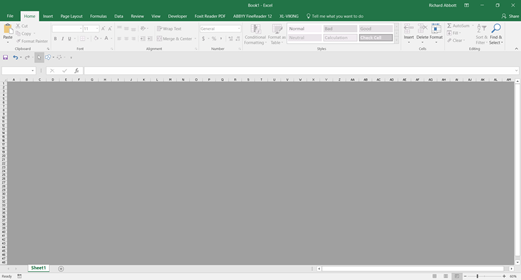
All the cells are ‘greyed-out’. This is because there is no defined Print Area. To define a Print Area, select a range of cells and go to the Page layout menu.
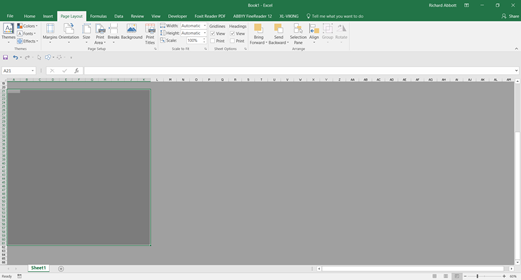
And click on the Print Area button:
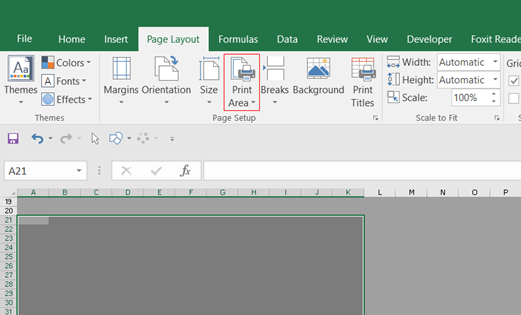
And click ‘Set Print Area’. The screen will now look like this:
When Excel is used in this way only the area of the white cells is printed. The grey area is not printed. When the term ‘Printed’ is used it also applies to the creation of pdf files. When a pdf file is created, the pdf will only show the Print Area of the page.
This is very useful and allows you to display only the results of an analysis on the printed part of the report. We use this concept extensively in many of our standard spreadsheets. The way you arrange and use your analysis within this framework is key and is covered in the next section.