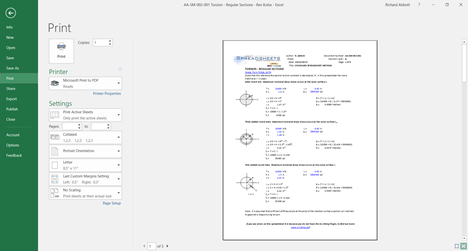
Excel does not cope well with different printers and is bad at adapting page breaks and scaling from one printer to another. An important rule to adopt is to set up all your report spreadsheets printer to ‘Microsoft Print to PDF’. This is done in the file menu. Select print from the menu on the left hand side.
It is best to avoid printing your report directly from Excel to a printer. It is better to create a .pdf file and then print the .pdf file or the part of the file that you want.
Column width should be set so when using the font and the size of font that works for your report you can display large numbers in individual cells.
The body text of our reports is 10 point Calibri and we base our page width on 11 columns. Each column is 81 pixels wide and an individual cell can display numbers up to 8 digits long.
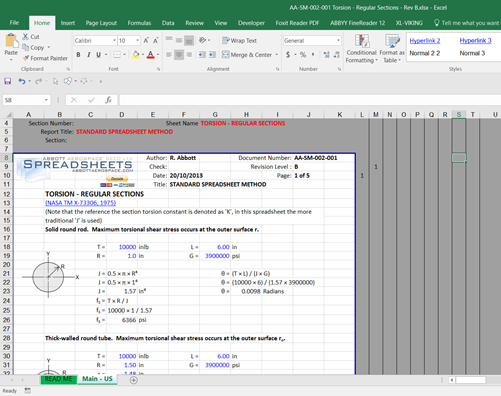
Note that numeric values will not spread over to the neighboring cells like text does. A numeric value must fit all in a single cell. If a n umber is too large to fit in a single cell you can merge cells to display numbers with higher character counts.
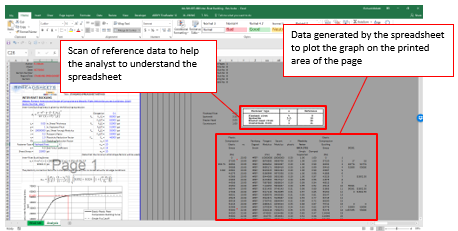
In Figure 26.2.3‑2 above you can see that to the right of the print area there are several columns that are narrower and marked with vertical border lines.
We use these columns to create figure and section numbering similar to Microsoft word.
We also reserve the first few rows of the sheet to contain sheet or document data. Note that both regions – the columns to the left of the page and the rows above the page – are not printed and are only visible to the analyst who is using the spreadsheet to create the report.
Other rules that we follow:
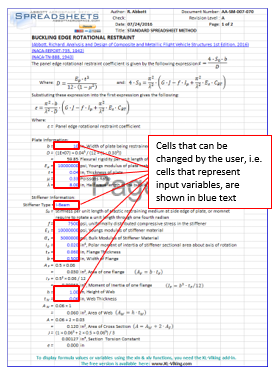
- Cell text color rule: All cells that contain numerical input data for the analysis in the sheet have blue text. This way everyone who uses the spreadsheet knows which cells are ‘input’ values.
- Page Header Rule: The top 4 or 5 rows of your page is the page header and contains the company information, report, subsection and page numbering information.
- Analysis off the page Rule: The non-displayed analysis for each page is kept within the same rows as the page.
- Column widths Rule: If you need to a numerical value too large for your column width, merge cells across multiple columns.
- Do not use Visual Basic: Visual basic is not recommended for use in report spreadsheets.
- Do not use Named Ranges: Names ranges in excel can cause problems when copying sections between reports, duplicating sheets within a report and copying from standard methods into reports. We have ceased use of all named ranges. See later section for workarounds.
- Avoid Using the Solver: Any process that must be triggered by the user that they cannot be intuitively aware of should be avoided. The Solver is the most common feature like this.
26.2.3.1. Cell Text Color Rule and Managing Input Data
It is important that you track which cells have input data that is typed in. This is for two reasons.
- In a large report, up to hundreds pf pages long, it is easy to forget which cells contain raw data and which cells reference other cells. When it comes time to do changes or updates to the reports it is important to know which cells should be manually updated with the change in the analysis parameters.
- When you pass the report on to your client or co-worker they should also know which cells have to be manually updated.
To get the most out of Excel as a report writing tool the author and the reader have to know what parts of the report are raw data and what parts are linked to the raw data.
For some reports, we will import finite element model output into one sheet, process it in another and write the report in a separate sheet. If the finite element model output data is kept in native format, updated runs of the finite element model can be written over the existing data and the report can update to the new input values automatically (with some judicious checking to ensure nothing went wrong along the way).
This kind of approach takes some forethought and careful setting up of how the imported finite element model output data is searched by the spreadsheet (using the INDEX and MATCH functions). When it is done properly is can save hours or days of time when inevitable loads or design updates occur.
We use blue text to denote inputs on the pages of the report section of the workbook.
26.2.3.2. Page Header (and Footer) Rule
We use the first few rows at the top of each page to create the page header:
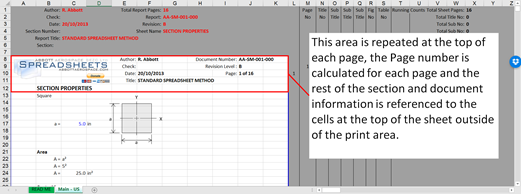
The page header can be formatted to suit any company report standard. Care must be taken to preserve this region of each page. It can easily be reconstituted by copying from an intact example, but it is good practice to consider this region of the page ‘out of bounds’.
For our in-house templates we do not use a page footer. On the standard analysis spreadsheets on the Abbott Aerospace website we do have the footer advertisement for XL-Viking, but this is an extra page element to manage so we avoid this where we can.
If you avoid the use of a footer on the worksheet then you can terminate pages early without having the footer change its position – a footer shown on the spreadsheet page will change position with the length of the page.
26.2.3.3. Analysis off the Page Rule
The art of creating a good report is to show only what you need to on the page of the report – and to show that information appropriately referenced and to the correct level of detail.
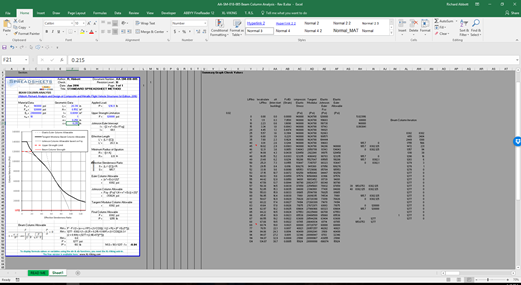
The area off to the right of the page is a region where you can place the workings of the analysis if it is not appropriate to show it on the page of the report. The area off to the right of the printed report page can be used as an area for rough calculations, to store a picture or scanned reference, or to place hyperlinks to on-line references. It can also be used to pass on notes to other people using the spreadsheet.
However, the cardinal rule is to keep all of the off-page work in line with the analysis shown on the page. This makes it possible to copy a complete discrete analysis, all the working out and all of the references by copying complete rows to another place in the report, or into another report/excel workbook file.
26.2.3.4. Column Widths Rule
Once you set your column width and font size (see previous note) for general text you must keep all of your pages the same number of columns wide, keep all of your columns the same width and use the same font throughout.
This is essential to create trouble-free copying between worksheets or reports.
This approach also means that you will encounter the same problems associated with your choice of column width and will develop and use the same work arounds for the common problems you will encounter.
25.2.3.5. Do not use Visual Basic Rule
This is a difficult rule to follow and involves lateral thinking for complex analysis problems. Visual basic is a very powerful tool and can be used to add some very useful functionality. But, we have a rule – do not use visual basic.
This is a rule with a caveat – we do use it in a particular way that is very limited and discourages ‘everyday’ use of visual basic.
Let’s first cover why you would not use visual basic. We try to make everything we do transportable. i.e. you can copy a section out of one spreadsheet into any other spreadsheet and it will work without any further changes.
If your analysis method relies on visual basic that is attached to the workbook or worksheet when you copy a set of cells or rows out into another workbook the visual basic code is left behind. When this happens, the analysis will not work.
We have found that you can force native Excel functions, singly or in combination, to perform very complex and powerful analyses.
We do use visual basic in our project office in a very particular way. We will only use it in the form of user defined functions. When we develop a useful user defined function we add it to our in-house Excel add-in and make it available on all our machines. This makes it possible to share spreadsheets and standard methods within our office.
This approach works fine for sharing material and methods in house but makes it hard to share your spreadsheets with the rest of the world – unless you share your excel add-ins with the rest of the world.
To effectively share your work with the rest of the world it is best practice to avoid all use of visual basic.
You may note that our standard spreadsheets use a visual basic add-in to help display mathematics. We developed this add-in to create critical additional functionality that Excel does not have, and to keep functionality constant for all users.
26.2.3.6. Do not use Named Ranges Rule
We have stopped using named ranges. This functionality in excel allows you to give a single cell or a range of cells a name rather than a cell reference. The problem with using this is that if you copy from multiple excel workbooks to a single excel workbook several problems will occur.
- Common names can often be used across multiple excel sources. For example, ‘F’ for force. Excel will automatically rename these to avoid name duplicates in a single workbook.
- If you define a name and don’t use it, it still exists in excel and persists as you copy the source material to multiple new workbooks. We have found that over time a workbook that has been developed from multiple excel sources using names can accumulate hundreds of unused names and eventually this will reduce stability and encourage crashes to occur.
If you do use named ranges in your workbooks these is an excellent free excel add-in that improves Excel’s native name management. It is available from JKP Application Development Services and is free. You can download it here: http://www.jkp-ads.com/officemarketplacenm-en.asp
26.2.3.7. Avoid Using the Solver
The solver is a useful tool. However, every time the analysis input data is updated the solver had to be manually triggered. If the user does not know that the result of the analysis depends on the solver being used then the answer produced by the spreadsheet will be incorrect.
There are some work-arounds. Where an iterative solution is required this can be set up in a series of cells with a simple check for convergence built in.
Our Beam-Column Analysis spreadsheet uses a simple iteration solver to solve the expression for the modification to the column allowable for eccentricity.
We have stopped using the solver (or the goal seek) and we have found an alternative and functioning solution every time where we would have used the solver.