The Excitement of Investors – Part 3 & The Inevitable Conclusion

A version of this article first appeared in our free newsletter, to subscribe click here

The first part of this article can be read here, and the second part here

Production Numbers

One of the common traits of the paradigm shifting new aircraft programs are the claims made regarding production numbers.

Archer Aircraft have made their projections publicly available here: https://s27.q4cdn.com/936913558/files/doc_presentations/Investor-Presentation.pdf

On slide 47 they give us the following numbers:

By 2030 they are projecting they will produce 2300 aircraft per year. For people with no experience of the aviation industry this may appear reasonable.

Archer is not alone in making these claims. If you are going to spend a billion dollars getting to market you had better have a story that shows you selling thousands, or tens of thousands of aircraft in the first decade.

The General Aviation Manufacturers Association do a great job of collecting and issuing industry data. You can get their latest report here: https://gama.aero/wp-content/uploads/GAMA_2019Databook_Final-2020-03-20.pdf

In 2019 the grand total for global sales of all general aviation aircraft (piston aircraft, turbo propeller aircraft and business jets) was 2658.

Archer, one company out of hundreds in the eVTOL/UAM sector, is projecting they will capture around 90% of the total general aviation market for all aircraft types in ten years. Or they will create an entirely new market equal to 90% of the existing general aviation market.

Little justification is given for Archers projected production and sales numbers. This is very similar to the claims of the infamous Eclipse aircraft who projected they would produce 2000 aircraft per year (https://en.wikipedia.org/wiki/Eclipse_500). 

Incorrect projections of this type are financially ruinous in the years immediately after certification. Companies who project high production numbers will base their price to customers on the economies of scale justified by their production numbers.

High production numbers also justify high levels of investment. In USD value adjusted to 2020 US Dollars, Eclipse raised and spent over $2Bn. This is not a problem if you are selling 2000 aircraft per year. It turned out to be a major problem if the most you sell in a single year is 161 aircraft.

Aviation supply chains are often not geared to supplying the volume of product necessary for these production numbers. This can force the aircraft OEM to vertically integrate and purchase their supplier to secure their supply chain. This necessitates even more investment, all dependent on the same aircraft product whose profitability is based on a volume of production based, in turn, on a market projection that is likely to be non-real

When the aircraft OEM fails to scale manufacturing fast enough to reach these numbers or the volume of orders fail to materialize, the aircraft OEM is forced to fulfill the purchase contracts at the low purchase price based on the assumed economies of scale that they can never achieve. The cost of production is greater than the contracted price of each aircraft. Investors, rather than seeing an ROI, end up having to invest even more and subsidize each aircraft that is delivered, increasing company debt at a time when profit was projected.

At this point it is typical that investors will cut their losses and leave.

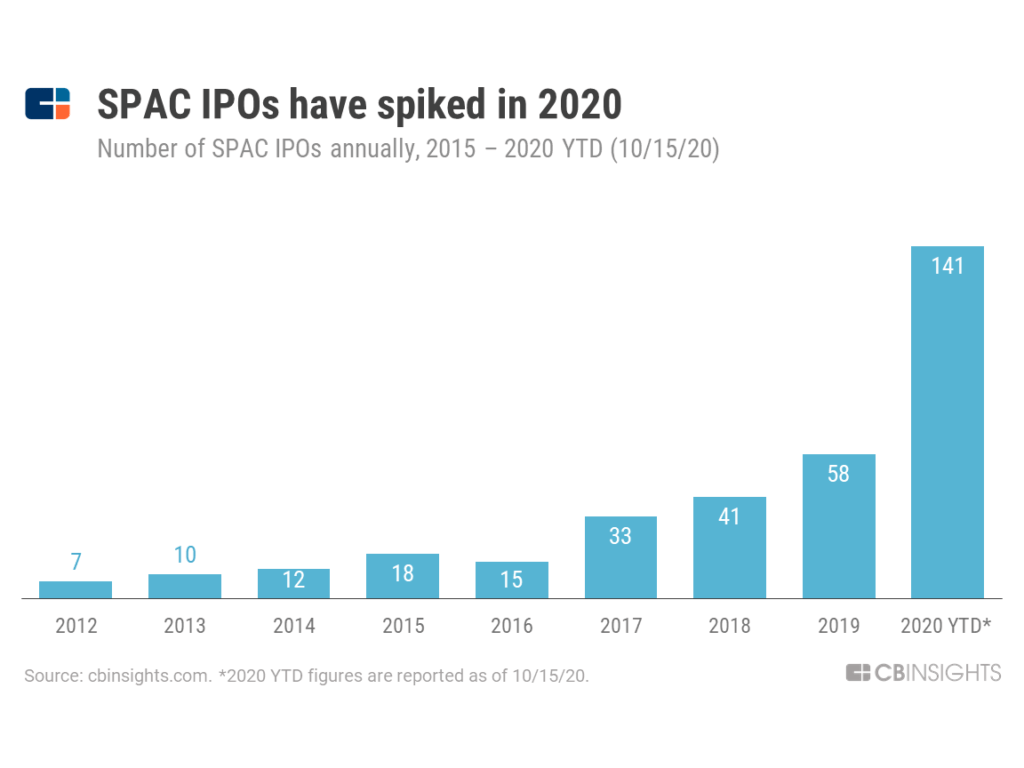
The investment that current eVTOL programs demand for development is unusually high for a part 23/part 27 development program. This amount of money is very difficult to raise through direct equity investments. This drives the necessity to raise money through using SPAC based IPOs.

In order to raise the amount of money necessary to pay for these programs you have to appeal to the lack of knowledge of the retail stock investor because appealing to the individual or fund manager private equity investor does not work. Hell, those early round private equity investors need a way to get a ROI before the product gets tested by the certification process and the market and the (almost) inevitable happens. 

Bankruptcy.

When you see a new aircraft program whose business plan shows outstanding returns based on capturing close to 100% of an existing market, or based on a market that does not exist, it is almost certain that it is an investment that will be very disappointing and there will be tears before bedtime.

Conclusion

When you see a program that combines electric propulsion with eye-popping production numbers, it is almost certain that the universe is getting ready to create some very disappointed investors .

One or the other may be possible. The fundamental problem is that the more limited the envelope of the vehicle the smaller the market is. The smaller the market is the higher the price you have to charge for the product to give an ROI. The higher you have to set the price the less appealing your limited envelope vehicle is and the smaller the market becomes, and so on……..

When a ride on your aircraft costs more than the purchase price of a moped, a vehicle that can can significantly outperform the aircraft – your market may not be as large as you told your investors.

My recommendation – buy a moped. Equip yourself with some real world urban mobility. It will be better for the planet as well.

The Excitement of Investors – Part 2

A version of this article first appeared in our free newsletter, to subscribe click here

The first part of this article can be read here.

Hydrogen power

Hydrogen is an interesting proposition. It has excellent energy density, around 3 times that of JetA. What could go wrong?

Density, cost and, you know, physics in general.

The density of hydrogen is famously low. So low that it was used to float airships. It was used for that purpose until it came to the attention of the public that it may catch fire in a rather spectacular fashion.

In the current application flammability is not the primary problem. The volume of the gas is.

This image has an empty alt attribute; its file name is fff7866f-c892-4b3a-8c7f-8f152115b46d.jpg

In its most energy dense form, stored cryogenically as a liquid below -252.8degC or around 20 degrees kelvin, hydrogen takes up about 3 times the volume of JetA for the same overall stored energy value. It is more efficient. However, the overall efficiency is yet to be established  as no practical system of this type has been installed in an aircraft and flown for any length of time.

While converting hydrogen to electric power can be efficient through the use of fuel cells (it is about twice the efficiency of an aviation turbine engine) there are additional losses either due to powering the active cryogenic storage system or hydrogen losses as the hydrogen warms up in a passive storage system. Note that  later heat of vaporization of hydrogen is also low. This means that the energy needed to cause the phase change from liquid to gas is low and the losses, as the mass of hydrogen warms up, may be significant.

So my estimate that on a mass basis cryogenic liquid hydrogen has a 1.5 times advantage over JetA being burned in a turbine. It will require more volume, but that is a problem that can be solved.

This is not too bad. Hydrogen will weigh less but take up a greater volume compared to JetA. This may be a viable solution.

Where do we put the Hydrogen? It will be hard to store in the wings of aircraft. I can’t see a practical system where the wings can store liquid at -252degC. Possibly in a blended wing body type configuration – this is one example:

Although the reasons used in the diagram for not storing in the wing is not entirely correct this type of configuration may be a practical solution.

For hydrogen powered aircraft the physics provide a performance level that has a commercial market. The safety aspects of Hydrogen are largely understood as well. Certification may be less problematic than for battery energy storage.

There are issues with hydrogen embrittlement of metallic materials. However, this can be addressed with life-limited items changed out on a known schedule, and adequate inspection.

There is nowhere near enough Hydrogen generation capacity or a means to deliver or store it on site at airports. Large infrastructure investments over a number of years will be required to make this possible.

For those with EAS (Eco-Anxiety Syndrome): Will hydrogen aircraft save the planet? No.

Hydrogen fuel cells use a range of rare earth metals and the durability of fuel cells used in service has not yet been established. The consumption of these materials is unknown and conversion of the global airline fleet, about 26,000 aircraft (https://www.statista.com/statistics/262971/aircraft-fleets-by-region-worldwide/) would create a massive demand for these materials. The ecological impact of this is not known.

For hydrogen powered aircraft to be widely used, it would require a new design of aircraft and a replacement of the global airline fleet. This may happen but it will be over a twenty to thirty year period.

For those who are living with CFS (Carbon Fear Syndrome): Not great news here for Hydrogen. While the conversion of hydrogen into energy does not produce CO2, the generation of hydrogen currently converts natural gas into Hydrogen and creates CO2 at this stage (https://en.wikipedia.org/wiki/Hydrogen_production)

This is a process that consumes energy, which has to be generated in a carbon neutral way.There are other ways to generate hydrogen but they are more expensive. Hydrogen already has a comparative cost disadvantage compared to JetA.

For those of us with RPS (Realistic Physics Syndrome): Hydrogen does quite well, the volume and mass required are within the bounds of commercial operation although there are significant problems left to solve.

EAS Score – 3/10
CFS Score – 3/10
RPS Score – 6/10

The Excitement of Investors – Part 1

A version of this article first appeared in our free newsletter, to subscribe click here

Introduction

I started working with aviation startup companies in 2001 and now our business consists of about 95% aviation startups. Occasionally I have been commissioned to carry out due diligence work for aviation investors, these assessments are based on some simple scratch tests that get you a quick feel for the likelihood a project is to meet investor expectations.

You also find out pretty quickly that investors do not like due diligence assessments that are not in agreement with their personal biases.

My approach is not luddite in nature. New technology is good, it is even better if it results in an overall superior aircraft product. However, the laws of physics are immutable, can be cruel, and they do not care if you try to attempt the impossible. They just passively guarantee your failure.

If you think the laws of physics are cruel and immutable, wait until you try to take your aircraft through certification.

In this newsletter I take a quick look at electric aircraft, hydrogen aircraft and ‘forward looking’ production numbers.

The usual caveats apply – there is lots of great engineering and innovation happening out there. That is not the issue – I am amazed by many of the eVTOL programs and their technical achievements. The level of investment, the price of the product, the performance of the product and the size of the market is where the concern should be targeted. Is there a market, what size is the market, and what price are they willing to bear for the performance you are offering?

I am afraid projects are avoiding realistic answers to these questions. To quote Adam Savage “I reject your reality and substitute my own.”. Many projects private reality and actual reality are further apart then most investors realize.

I have been blessed to have seen the good, the bad, the ugly and the SPAC.

Batteries

What’s wrong with electric aircraft? Generally nothing. Electricity exists, batteries exist and motors exist. They work. Almost 100% of the appliances in your home are electrical and they are all efficient and reliable. 

Current battery technology, when compared to a modern turbine engine and jet fuel is about 14 times less weight efficient. A good rule of thumb that if you convert over a conventional aircraft to electric power, flying at the same weight and speed you will have approximately 14 times less range or endurance.

When ever you see the published figures for an electric aircraft project, take an equivalent traditional form of air transport and divide their performance numbers by 14. If the electric aircraft range and endurance numbers are significantly higher than the number you come up with they are basing their numbers on a yet to exist battery technology, they believe they have made an aerodynamic breakthrough that will significantly reduce the drag, they have got their math wrong or you are looking at ‘shine’ added to the performance numbers to attract investment. Or a combination of all of the above.

A good example is the Eviation Alice (https://www.eviation.co/aircraft/#1). They claim 9 passengers, 440Nm, 220knots. It is not clear if these metrics are able to occur simultaneously but as no qualifier is given let’s make that assumption as it is clearly the assumption you are encouraged to make.

The equivalent traditional aircraft would be the PC-12 a turbine engine, 9 passenger aircraft. This has a cruise speed of 285knots (https://www.pilatus-aircraft.com/en/fly/pc-12) in their long range cruise configuration (255knots) with 6 passengers they have a maximum range of 1568Nm

If the PC-12 were to be electrified we can divide those numbers by 14 to get a rough idea for the range – 1568 / 14 = 112Nm.

Eviation may have discovered some hitherto unknown performance breakthrough. With their 440Nm range compared to the expected 112Nm range they have achieved a factor of around 4.0 over what a crude interpretation of conventional physics would predict.

Examining the data on their website it can be found that batteries will take up 60% of the MTOW and the occupants will weigh about 2500lb. With an MTOW of 14000lb the useful load constitutes 2500 / 14000 = 18% (approx.). This leaves the aircraft airframe and systems (the conventional empty weight) at 100 – (60 + 18) = 22% of MTOW.

This looks like one of those physics defying breakthroughs. We can compare it to available data. This is an oft used graph that I believe originated in the excellent book by Dan Raymer (https://arc.aiaa.org/doi/book/10.2514/4.104909)

From examination of the empty weight fraction defined on the y axis of the above graph, a value of 0.22 is literally off the scale.

I am not picking on Eviation – at least they have made their metrics publicly available and they may have some very clever justification for these numbers – some new materials technology to get the empty weight down to 22% and new battery technology that will give a huge improvement over current battery energy density. However, the skeptical side of me finds this hard to believe.

It should be noted that these claims are not extraordinary compared to similar projects. Indeed these level of claims have become commonplace. Once a level of acceptable level of ‘forward looking metrics’ has been established, in order to compete in the market for investment other projects have to match or even improve on the same ‘forward looking metrics’ to get an edge in the market for investment.

I am not going to cover the failure modes of current battery technology. They are not favorable for certification or overall safety. They can be mitigated but this takes additional weight and reduces the effective energy density of a battery powered system further still.

For those with EAS (Eco-Anxiety Syndrome): Will electric aircraft save the planet? No.

We still have to generate the power and create the infrastructure to charge the batteries when the aircraft are on the ground. Batteries use lots of nasty chemicals and they have a finite life and require safe disposal.

For those who are living with CFS (Carbon Fear Syndrome): The good news is that overall there is a chance that electric aircraft may produce less carbon than JetA fuelled aircraft.

For those of us with RPS (Realistic Physics Syndrome): Electric powered flight is possible and has been done. The commercial applications for aircraft with endurance less than the 1910 Wright Flyer Model B (https://en.wikipedia.org/wiki/Wright_Model_B) are, ahem, slightly limited.

EAS Score – 2/10

CFS Score – 3.5/10

RPS Score – 4/10

In the next article we tackle hydrogen.

We need to talk about SPACs

A version of this article first appeared in our free newsletter, to subscribe click here

This month SPACs have been in the news, linked to several eVTOL companies. The most recent and most hyped of these is Archer.

Their press release on this issue is here:

https://investors.archer.com/news/news-details/2021/Archer-A-Leading-Urban-Air-Mobility-Company-To-List-On-NYSE-Through-Merger-With-Atlas-Crest-Investment-Corp/default.aspx

They have also put their Investor Relations Side Deck on line and made it publicly available here: https://investors.archer.com/files/doc_financials/Archer-Investor-Relations-Deck.pdf

It contains the label ‘private and confidential’ so please handle with care.

To cut to the chase the key aspects of this upcoming IPO are taken from the Archer press released and shown below (these are clipped directly from the link above):

  • Pro forma equity value of the merger is expected to be approximately $3.8 billion at the $10.00 per share PIPE price.
  • Archer has also signed an aircraft purchase agreement and collaboration agreement with United Airlines as part of the company’s commitment to decarbonization.

Let’s examine the company that is promoting a speculative self valuation of 3.8Bn USD.

Technology and Innovation: At the time of writing I could not find any patents that had been filed under the name of “Archer Aviation” (or any variation of that name I looked for). There may be a good reason why they are not seeking protection for their Intellectual Property, but the fact remains that they have filed for no patents and have received no patents.

Product: The company has no sales and the product exists only in a scale form, as far as I am aware only a still image has been released of the prototype:

Slide 15 of the presentation gives the performance numbers: 60 miles, 150mph. It is unclear if that is the top speed or the average speed for a 60 mile trip. If we assume this is the average speed this gives a trip length of 60/150 = 0.4 Hours or 24 minutes. If the aircraft has the standard day VFR reserve of 30 minutes the batteries will provide it with a total of 54 minutes flying time.

Lets make some rough guesses for this type of aircraft – in hover it will consume 1.5MW of power and in forward flight 200kw. Assuming the craft spends 5 minutes in hover and the remaining 19 minutes in forward flight for flight without reserve the total energy requirement is 188333Wh. If we assume an installed battery weight of 210Wh/kg the total weight of batteries without reserve runs to 897kg or 1883 lb. If we add 30 minutes of reserve the battery weight increases to 2880lbs. Assuming 4 passengers and pilot will create a 1200lb payload and assuming the empty weight fraction is 50% this gives a total vehicle weight of around 8200lb. This aircraft would likely consume  more than 1.5MW in hover but it is not too far out. With 12 lift rotors each lift rotor would have to generate 8200/12 = 680lb of thrust. This is not impossible.

Sales and Pre-Orders: Archer has stated “United, together with Mesa Airlines, would acquire a fleet of up to 200 of these electric aircraft“, “Booked >$1 billion in orders”. United’s own press release includes the following wording “Once the aircraft are in operation and have met United’s operating and business requirements, United, together with Mesa Airlines, would acquire a fleet of up to 200 of these electric aircraft”.

These contracted purchases are very conditional and the key phrase here is “up to”. “Up to” includes the number zero.

Team: The job of the leadership of the company is to develop an aircraft and get it through the type certification and production certification process, to market and into revenue. From the investor presentation, slide 10, the only member of the Leadership team to have taken an aircraft product through the certification process is Eric Wright, formerly of Piper. Fortunately he is in the position of Head of Certification. However the rest of the leadership team are weak on aircraft certification. Eric will have his work cut out for him.

Examining the overall program we can make the following subjective judgements. The product has no IP they chose to protect, the aircraft doesn’t exist yet at the full scale. The performance is not impossible, although there is no existing market for a flying vehicle with an endurance of less than half an hour. There are contracted orders but the contracts took to be constructed so there is less than the usual commitment you would expect of a ‘sale’.The leadership team does not have a significant amount of experience in taking an aircraft through the certification and to the market.

Developing new aircraft products inside new organizations is very, very difficult. You need to get almost everything right all the time. From a detailed examination of this program it is not likely to succeed and the valuation of 3.8Bn is based on a future based on a set of ‘forward looking statements’ that are very unlikely to coincide with reality.

Very high profile projects like Archer take up so much of the investment space and the available investment dollars. This is problematic. Very high risk projects are unlikely to make it to market and give a return on investment. This monopolization of the investment market makes lower risk projects less able to get funded. When these higher risks play out in the real world it harms the entire aviation sector and leaves the industry with few funded, viable projects.

Archer represents a real investment opportunity. Is it based on a real aircraft, a real market and a real return on investment? Or is the investment in a stock that will gain in excitement and value and only offer a bubble based return for those who get out while the market sentiment remains high?

United’s role in this transaction is also worthy of attention. They made an investment https://financialpost.com/pmn/business-pmn/archer-to-go-public-united-airlines-invests-and-orders-electric-aircraft placed an ‘order’ and the SPAC IPO announcement were all made on the same day – the same day everyone involved also issued their press releases.

With over 250 eVTOL projects and counting what are the chances United have backed the right horse? Does it even matter?

You can draw your own conclusions about who stands to gain from this situation.

Safety First, Safety Second, Safety Third…..

A version of this article first appeared in our free newsletter, to subscribe click here

Bryan Lynch, the CEO of Explorer recently brought some of the introductory wording to amendment 64 of the part 23 regulations to my attention.

While reading the preamble I did notice that we were mentioned by name (https://www.federalregister.gov/d/2016-30246/p-197) as raising some issues related to the change on legal grounds. Gratifying to see that our comments were at least acknowledged.

However, the more interesting part of the federal register is this comment

https://www.federalregister.gov/d/2016-30246/p-1441

“The following table shows the estimated benefits and costs of the final rule. Another way to consider the expected net benefit to the society is if the rule saves only one human life by improving stall characteristics and stall warnings, this alone would result in benefits which substantially outweigh the costs.”
(Emphasis is added)

Human life is very important. I have one that I really enjoy. Everyone I like, and even people I don’t particularly like have a human life of their own.

What value do we place on a life? Sometimes lives are cheap. And I am not being political here, but as a society we allow and subsidize abortion and euthanasia. Those lives are so cheap we pay to get rid of them.

We as a society also make unconscious, and concealed value judgements regarding human lives. Where we have public health care systems, as a society we make a choice. Every penny, dollar or euro we spend on public sector pensions or a politician’s pay and perks is money not spent on cancer treatments or dialysis. When it comes to public sector compensation, lives get much cheaper than we realize.

People creating public policy have no problem causing additional costs to private industry in order to ‘save lives’. Ask them to take a moderate cut to their pay or benefits to do the same and the answers will range from a simple no to public sector union outrage, strikes and litigation.

This can also be seen in the actions of the new Biden administration. They cancelled the Keystone pipeline, ostensibly to help reduce the effects of climate change. It may help climate change but it certainly will negatively affect the financial well being of thousands of private citizens and hundreds of private corporations. I expect that measure did not directly harm a single government employee.

How about we reduce the pay and perks of all public employees by 10% to create a ‘defeat climate change’ fund to take climate action and fund green energy. You know, I get the feeling that this kind of public sector action is never going to happen. Climate action would get a lot less attention if the cost came out of the pockets of public sector employees.

I am not saying that climate change is not real or that cancelling the pipeline will not mitigate it in some way. I am saying that increasing the safety of society always comes at the direct expense of the private sector and never causes direct financial hardship to the public sector. If climate action were to affect the policy makers and public employees directly I guarantee that another higher priority crisis would be swiftly found that placed the burden on the private sector.

This is not a cynical interpretation of reality – it is an accurate description of reality.

Safety increases costs of development, compliance and direct and indirect costs to the consumer. The product costs more and the product takes longer to get to market (delaying potential benefit). The government has to increase oversight to ensure that the new safety rules are being followed so there is an increase in public costs. The public costs are inevitably sourced from taxation of the private individuals and companies.

The new part 23 regulations are meant to make it easier to certify aircraft. Well, that is great news! If that is the case we should be able to see that reduction in difficulty in a related reduction in oversight cost. Imagine my shock when I could not see the fingerprint of the reduction in oversight cost associate with a reduction in certification difficulty in the FAA budget::

https://nataspolicyplaybook.wordpress.com/tag/nata/

FAA Budget Graph

Hmmm. I am joking, of course. No government agency has ever put into place a policy that would justify a reduction of their own budget – that’s crazy talk!

We can take the response to the recent pandemic as the same precautionary principle, writ large. In the name of safety we are destroying private businesses and lives while being spectacularly unsuccessful at protecting the vulnerable. In Ontario we are failing to prevent COVID outbreaks in long term care homes. As of January the 31st 2021 we have had 3600 deaths in long term care homes in Ontario out of a total of 6200 deaths – that is more than half of all deaths. Long term care residents represent approximately 0.7% of the residents in Ontario. It is not a mystery who is at a massively disproportionate risk – quick! Shut down the entire economy! (well, not the public sector – just the private sector)

So the safety measures that have harmed millions of people in Ontario and have put over a million people out of work have failed to protect vulnerable people. What price are we paying for our safety?

https://www.fao-on.org/en/Blog/Publications/labour-market-04-2020

I have been trying to find a figure of public employees who have lost their jobs because of this and the best number I can find is in the link above that says that ‘public administration’ lost 13,000 out of over 1,000,000 job losses or 1.2% of all job losses. I expect these are private contractors who were let go from their contracts.

It appears that we have got to the point where we are willing to pay the cost of private sector survival in order to achieve an ineffective measure of safety.

What trajectory does this put us on? The safety culture that is slowly being imposed on us is harming innovation and reducing free commercial operation as the ever increasing financial burden of our safety culture is placed solely on the shoulders of private industry. Is it worth it? I wonder how the ever increasing safety culture will affect the eVTOL companies that appear to embrace the new part 23 regulations. Do you think they understand how this works?

Innovation is never risk free. In the past, society used to accept risk and danger as the cost of progress and government used to let people, innovators and the market trade personal risk for reward.

So what cost for one human life? It depends….if you are prenatal, wanting to die or a resident in an Ontario long term care home – practically zero. If you are a passenger in an air vehicle, can it ever be high enough?

Who bears the cost of your safety? The government may, sorry, will inevitably take credit for it, but they never actually pay the cost. 

Aerial Urban Mobility Rankings (2020 Update)

A version of this article first appeared in our free newsletter, to subscribe click here

I will start this article with an explanation of how the rankings are generated, then show the results of the rankings.

At the end I will give some advice based on my experience of working in the field for a number of years. 

Here we go…

Preamble
The rankings are based on a weighted score system that I have developed to represent the best of my knowledge and experience regarding technical, certification and commercial (market) risks.

This method has my own bias baked into it (despite my best efforts) and I welcome any challenge or disagreement. 

The aim of this effort is not to make people feel bad or harm any project. However, there are certain unavoidable realities regarding the certification process, the cost of developing and producing complex air vehicles and the unusual nature of the market regarding aircraft purchases and the flying public.

There are always winners and losers, and, in aerospace development there are no participation trophies. The failure of a program represents the loss of most, or all, of the value of the investment in that failed program. 

The purpose of these rankings is not to identify those who will fail. I do not claim to be able to tell the future. The rankings are all relative so all the programs may fail or all of them may succeed. However, the rankings represent my best guess at the relative risk of failure of all of the programs considered.

You are welcome to address any comments to me directly at [email protected]

And a final word: I work with many of the eVTOL programs in this list. I have done paid work, pro bono and informal advising and technical work for many programs. It is a privilege to work with all of these programs. They are all doing their best to push the industry forward and develop new forms of transportation. I have done my best to avoid my relationships to any of these programs influencing my assessment.

The Assessment
The assessment is based on a modified set of weighted factors based on the white paper I authored in 2018: https://www.abbottaerospace.com/wpdm-package/aa-wp-2018-001/

I have updated the weighting and the method. If you are interested in the method please contact me for more information.
The assessment is broken down into the sub categories on the vertical flight society website. These are: Vectored Thrust, Lift + Cruise, Wingless Multicopter, Hoverbikes and Electric Rotorcraft.

These categories are all scored against the same metrics and so vehicles in these separate categories can be compared against each other.

A good number of the vehicles included in this assessment are pure technology demonstrators or early prototypes. For these immature designs, the outcome of my analysis and final placing is unkind and these projects are included for interest only.

The assessments are based on the state of current technology and the current regulations and interpretation. These rankings are not a criticism of the inherent value of the idea, it is my assessment of the likelihood of the design being brought to market and achieving commercial success in the current environment.

Categorical Comparative Assessment
All of the assessments are shown in a 2 dimensional space plotting a derived certification quotient (encompassing technical and regulatory risk – level of difficulty to develop and certify) and a similarly derived market quotient (encompassing all aspects of commercial risk – what is the likely market demand for the aircraft)

The 2D plots are all in the form shown below:

The top right corner of the graph represents a high score for both certification and and market quotients, the lower left hand corner of the graph represents a low score for both certification and market quotients

The comparative assessments within the separate categories are shown below:

Vectored Thrust

Lift + Cruise

Wingless Multicopter

Hover Bikes

Electric Rotorcraft

Summary and Combinations

The different types of VTOL aircraft when combined on the same graph give the following result:

And this is the same graph showing the projects with labels:

All projects considered and their scores are shown below in score order:

PositionScoreProject
10.662Transcend Air Vy 400
20.655Dufour aEro2
30.624Flexcraft
40.612DeLorean Aerospace DR-7
50.560Samad Aerospace Starling Jet
60.554Pegasus Universal Aerospace Vertical Business Jet
70.481Cartivator SkyDrive
80.466Ascendance Flight Technologies Atea
90.457Lazzarini Hover Coupé
100.454XTI Aircraft Trifan 600
110.407Alaka’i Technologies Skai
120.388Gizio EJ420 ElectroJet
130.386Vertical Aerospace (unmanned)
140.378EHang 184
150.371Beta Technologies (prototype)
160.368Lazzarini FD-One
170.365Moller Skycar M200
180.359EHang 216
190.354Horus Hoverbike
200.345EAC Whisper
210.335Voyzon e-VOTO
220.333AeroMobil 5.0
230.330Frogs 282
240.327Airbus Helicopters CityAirbus
250.318Astro Elroy (“Passenger Drone”)
260.314Imaginactive Ambular
270.304Avioneo Robotics Avioneo 2345
280.300Davies “Tesla Concept Model V”
290.290Alauda Airspeeder
300.290AirCar
310.283Moog SureFly
320.283Moog SureFly
330.280Tier One Modified Robinson R44
340.267China Helicopter Research and Development Institute Electric Helicopter (CHRDI AVIC)
350.266Kármán XK-1
360.263Airflight
370.263Assen A1
380.261Zuri
390.260Bay Zoltán Flike
400.260SkyDrive SD-XX
410.257ALI Technologies Xturismo
420.244Piasecki PA-890
430.234HoverSurf Scorpion
440.213Flyter PAC VTOL 720-200
450.210ALI Technologies Hover Bike
460.210AirspaceX MOBi
470.205Eco’Trip
480.204Edea 22/1 Jay
490.201Jetson Aero Speeder
500.197Air Transportation Technology Catapult One – I, II
510.195Ambular 2.0
520.187UAVOS SumoAir
530.174Assen Aeronautics A2 Avenger
540.174Wisk
550.172Heitech Cruiser
560.170Baykar Cezeri
570.166Baaz Concept Design
580.165SkyDrive SD-02
590.164Aerodyne Vector
600.164Gizio DDRH/DDVL
610.162Ray Research VTOL Aircraft
620.162Removed
630.159Leap Vantage – I
640.156Pop.Up Next
650.156Malloy Aeronautics Hoverbike
660.147Heitech Air F1
670.141Archer
680.136Davinci ZeroG
690.134Zenith Altitude EOPA
700.133Hemanth Sudhakaran AVEM
710.132Aquinea ENAC Volta
720.131PDRL AeroHans 2S
730.131Kovacs Flike
740.125Kronstadt Air Taxi
750.124EVA Valkyr
760.122Flyt Aerospace FlytCycle
770.112Digi Robotics DroFire
780.103Rolls-Royce EVTOL
790.101Lazzarini Linux
800.098Applied VTOL Concepts Epiphany™ FLYING CARpet
810.093Deep Blue Aviation MX 18 Silhouette M
820.092PAL-V International Liberty
830.085Flexcraft Test Bench RPV
840.084Lazzarini I.F.O.
850.084Aston Martin Volante
860.083Ambular 3.0
870.080Overair (Karem) Butterfly
880.079Joby Aviation S4
890.078Gravity X Koncepto Millenya
900.074Zeva Zero
910.072Beta Technologies ALIA
920.071Aurora Flight Sciences PAV
930.070Neo Aeronautics Crimson S8
940.069Vinati F-Helix
950.066EVA X01
960.065Hyundai S-A1
970.064OVER LLC
980.062Skyworks Global eGyro
990.061CAPS
1000.060Samad Aerospace HUMA
1010.058NFT ASKA
1020.057Embraer Pulse Concept
1030.052AirisOne
1040.050Robathan Range Rover eVTOL
1050.047CHRDI AVIC Sylan
1060.045AutoGyro eCavalon
1070.043MyDraco
1080.041Flutr Motors Flutr
1090.037Fraundorfer Aeronautics Tensor
1100.036DragonAir Airboard 1 & 2 – II
1110.030Varon V210
1120.023Moscow Team AI Kamchatka
1130.021SKYLYS Aircraft AO
1140.020VerdeGo Aero PAT200
1150.017SkyCab
1160.015Georgia Tech HummingBuzz – I
1170.012Micor Technologies Variable Geometry VTOL aircraft (VAGEV)
1180.007FanFlyer
1190.006Avianovations Hepard
1200.003Trek Aerospace FlyKart 2 – I, II
121-0.004Grug Group Business eVTOL Jet
122-0.006Uber Elevate eCRM-001
123-0.009Athena Aero
124-0.012Aufeer Design Flying Taxi
125-0.014Tecnalia
126-0.015Moller Skycar M400
127-0.020Prime Design Consultancy Services Haricopter X1-B
128-0.021Flyter PAC VTOL 420-120
129-0.023Embraer DreamMaker
130-0.023ElectraFly ElectraFlyer
131-0.026Manta Aircraft ANN1
132-0.026Heitech Magic Cloud
133-0.034Leap Aeronautics
134-0.043Colugo Systems
135-0.044Macchina Volontis Flying Car
136-0.051Terrafugia TF-X
137-0.051PFV Personal Flying Vehicle #1
138-0.052PteroDynamics Transwing
139-0.053Aliptera ADR-1 Dragon Rider
140-0.054Napoleon Aero VTOL
141-0.056Edea 22/2 Squid – II
142-0.062COMAC eVTOL
143-0.064CycloTech Compound Helicopter
144-0.065Micor Technologies Advanced Individual VTOL Aircraft (AIVA)
145-0.066KARI PAV
146-0.067Swallow VTOL
147-0.080aeroG Aviation aG-4 Liberty
148-0.080Opener BlackFly V3
149-0.081Vickers WAVE eVTOL
150-0.082Ryerson Helium – II, III
151-0.087Esprit Aeronautics Lancer ePAV
152-0.088Skyworks Vertijet
153-0.096Carter Aviation Air Taxi/Jaunt
154-0.097Detroit Flying Cars WD-1
155-0.098LIFT Hexa
156-0.099Doroni Carbon One
157-0.100rFlight rWing
158-0.104Stuttgart Aerospace Apollo
159-0.110Happy Takeoff Prism
160-0.110Jetoptera J2000
161-0.122VRCO NeoXCraft
162-0.124JAXA Hornisse 2B
163-0.125Gizio CellCraft G150
164-0.127AutoFlightX V600
165-0.128Aeroxo ERA Aviabike – I, II
166-0.130VOX Aircraft M400
167-0.132Ray Research Dart Flyer
168-0.134Neva Aerospace AirQuadOne
169-0.140Innowings Aerospace PKOK
170-0.143Horizon AutoCopters Auto-Copter
171-0.145Jaunt Air Mobility Journey
172-0.153Kitty Hawk Heaviside
173-0.161GroundAero Sport Utility Aircraft
174-0.163Electric Jet Aircraft EJ-1S
175-0.174VTOL Aviation Abhiyaan
176-0.175Gizio CellCraft G450
177-0.182SkyBoom eVTOL Automobiles
178-0.183Raven – III
179-0.184B-Technology Beccarii
180-0.184Collaborative Mini-Bee
181-0.185Bell Nexus
182-0.186VTOL Aviation India Abhigyaan NX
183-0.197Lilium Jet
184-0.203Industry Network Cocooon X-1
185-0.204Bell Nexus 6HX
186-0.205EXA Air Car
187-0.212Terrafugia TF-2 Tiltrotor
188-0.216Autonomous Flight Y6S
189-0.228KineticCo Aerospace and Advanced Technologies
190-0.234CFC AirCAR
191-0.235NEAE-GSI eVTOL-BUS
192-0.235Prime Design Consultancy Services Haricopter X1-Q
193-0.238Scoop Pegasus 1 – I
194-0.239HoverSurf Formula
195-0.242chAIR Multicopter
196-0.243Hirobo Bit
197-0.250Urban Aeronautics CityHawk
198-0.251Paragon VTOL Aerospace T21 Raptor
199-0.254Grug Group Ghost X V1
200-0.254Grug Group Ghost X V1
201-0.257Grug Group Ghost X V3
202-0.264AMSL Aero Vertiia
203-0.271Aliptera APV-1
204-0.271GyroBike
205-0.276A³ Vahana
206-0.279Hoversurf Formula (No wing)
207-0.282ACS Aviation
208-0.299Aeronext Flying Gondola
209-0.302Gizio EJ11 ElectroJet
210-0.302CycloTech Passenger Demonstrator
211-0.338Imaginactive Transvolution
212-0.345Bartini Flying Car
213-0.354Sharifzadeh Zero G eCruzer
214-0.358Neoptera eOpter
215-0.374Vertiia
216-0.385HoverSurf Drone Taxi R-1
217-0.417Vision VTOL
218-0.467Advanced System Engineering – FIPSI WX4
219-0.507Advanced System Engineering – FIPSI BX4
220-0.536HopFlyt Venturi

The spread of scores were assessed to determine if the distribution included any anomalies that would indicate an error in the application of the scoring algorithm:

It appears that the application of the scoring method is free of obvious errors.

Summary of Results and ‘Awards’
The top scoring projects are unchanged from the initial assessment made in 2018. The top five eVTOL projects that exhibit the most favourable characteristics for certification and commercial success are:

PositionScoreProject
10.662Transcend Air Vy 400
20.655Dufour aEro2
30.624Flexcraft
40.612DeLorean Aerospace DR-7
50.560Samad Aerospace Starling Jet

Below are high scoring projects in some of the categories that I use for the assessment

Most Beautiful (In no particular order and according to my taste)

Davies “Tesla Concept Model V”

DeLorean Aerospace DR-7

Lazzarini Hover Coupé 

ALI Technologies Xturismo

Most Unusual

Industry Network Cocoon X-1

Robathan Range Rover eVTOL

Volerian

Zeva Zero

Avianovations Hepard

Advice

This is where I sound off on what I think may help improve a project’s chances of getting to market and being successful once you get there.

This section is as populated with my personal bias as the rest of this article, these opinions are all my own. 

  1.  Gatekeepers: You have to get through the certification process. The award of a type certificate depends on a succession of findings of compliance for each paragraph of the regulations. Achieving a finding of compliance relies on the person awarding that finding. Develop your relationships with those individuals. Inspire confidence and over achieve with presenting good quality data in all circumstances. Management of the perception of risk is paramount.
     
  2.  Money: The total cost of development is directly related to the time spent in development and certification. Keep your team small (minimize your $ per hour), expedite your certification program (minimize the total number of hours), reduce risks (minimize the chance of the number of hours increasing). Do not expand your team beyond the minimum size until you have a frozen detailed product specification and an approved certification plan. It is very easy to get into certification, very difficult to get out of it.
     
  3. Batteries: Assumptions of future battery energy density are unwise. Overestimation of present battery energy density is unwise. 250Kwh/Kg may be presently theoretically achievable. For the installed system it never is. Battery charge times and battery lifetimes have to be practically addressed. Thermal failure modes of Li-Po batteries have to be addressed and mitigated. Current installed battery/electrical drive systems are approximately 14 times less weight efficient than a turboprop system burning JetA. 
     
  4. Hydrogen: Great energy density, lousy density. Expensive. No infrastructure. Hydrogen is a form of displaced NIMBY carbon dioxide generation. Your aircraft may be carbon neutral, the supply chain for your fuel is not.
     
  5. Mistakes: Everyone makes mistakes. It is very cost effective to learn from other people’s mistakes, it is very expensive to learn from your own. 

In general, the air vehicle market has proven to be historically very conservative. It is very risk averse. In part this is because of the cost of insuring aircraft and in part because of the flying public’s general low threshold of perceived personal risk.

Just as you have to manage the perception of risk in the mind of the regulator you have to do the same for the insurance market and the minds of your future customers and users. We engineers find innovation very attractive and exciting. Other institutions and individuals do not feel the same way we do. There is some good data on the fear of flying and anxiety regarding flying here: Fear of Flying Statistics (2020 Data)

There is a trade off between promoting the new and exciting and reinforcing the dependable and reliable.

I fear that most eVTOL programs concentrate on the former and ignore the latter and this will harm them both in the certification process and with the customers.

Part 23 Does It Again

A version of this article first appeared in our free newsletter, to subscribe click here

Part of my job is advising companies on the best strategy to enter and exit the aircraft certification process. My strategy has always been to do all your work in advance. You scrutinize the advisory materials and policy papers. You examine the recent certified programs and any special conditions applied to those programs, and you complete your design and your compliance plan so the design, your compliance plan and the regulatory requirements are in complete and perfect harmony.

Failure to do this will inevitably add time and expense to the program. Time and money are both things that are in short supply.

There was a communication sent out by the FAA in the last few weeks that makes this approach of doing your work in advance of the official certification program difficult, if not impossible.

It used to be that you could read the regulations and with the direct meaning be sure whether or not your design would comply.

I remember nearly 20 years ago on an unnamed program the CEO of the company called engineering into a special meeting and explained to us that there were grey areas in the regulations. Where we found these grey areas we must favor the company position and not the FAA’s position. None of us were really sure what he meant by this. The whole meeting was hard to take seriously as our DER stood behind the CEO, out of his line of sight shaking his head from side to side and catching each of our eyes in turn.

After we came out of the meeting with the CEO, the FAA delegate in question pulled all of us into a hastily convened meeting and explained to us that there are no grey areas in the regulations and if we thought we had found one we should come to him and he would give us clarity. He then told us that he had talked to the local ACO and they were sending one of the senior staff down to explain to the CEO how aircraft certification worked. We did not hear from the CEO on this subject again.

Of course there can be situations where the project you are working on has some unusual design which causes some real thought as to how it may fit into your compliance program. It is very rare on a conventional aircraft program to find something that is not explicitly covered by the regulations.

That was until the last few years. 

The FAA has sent out the following clarification to help with the amendment 64 part 23 regulations:

https://www.federalregister.gov/documents/2020/09/22/2020-17911/accepted-means-of-compliance-airworthiness-standards-normal-category-airplanes

It includes this paragraph:

“However, for means of compliance identified in the following list, Aircraft Type Code compliance matrix tables, which define applicability of the individual requirements of given standards, are not accepted in any ASTM F44 standard. Due to errors identified in the Aircraft Type Code compliance matrix tables, applicability of individual requirements of standards must be established with the Small Airplane Standards Branch.”

The list that follows has some specific substitutions but seems to encompass almost all of the regulations.

That should strike fear into the heart of anyone with any aircraft certification experience. You cannot trust the clear direct interpretation of the working of the regulations and the ASTM F44 set of standards. Interpretation and understanding of the requirements can only be trusted if they are discussed directly with the FAA.

The question we have to resolve now is: Are the regulations and ‘advisory standards’ (or whatever the ASTM documentation is) fit for purpose?

I think we can put aside the question of whether the recent change to the regulations is an improvement that will ease the path through certification. The questions we have to wrestle with now are:

Is it possible/practical to certify with the combination of the regulations and the ASTM mandatory/non mandatory commercial standards?

How close a relationship do you have to have with the FAA to get the attention you require to navigate through the patchwork of regulations, ASTM standards, legacy advisory circulars and policy letters?

These are serious questions for all companies in the field, but especially for aerospace startup ventures. If you mis-plan and fail to correctly conduct your certification program that can be the end of not only the program, but the company itself.

Considering the situation described earlier of the CEO addressing engineering in the meeting – now he would be completely correct. The combination of the new regulations and the pay to play ASTM standards have created 50 shades of certification grey.

Where do we go from here?

Canada? Brazil?

Composite Bearing Analysis

A version of this article first appeared in our free newsletter, to subscribe click here

An interesting technical issue came up this month that I posted on the Aircraft Stress Analysis LinkedIn group that I run. You can review the original post and the comments here: https://www.linkedin.com/feed/update/urn:li:activity:6701526665463414784

This is the original question:

“Bearing ‘yield’ of carbon fiber came up on a project yesterday. As long as the failure mode is not pull-out to the side of a sheet or flange, the bearing failure of carbon composite is non linear and progressive. For ultimate load cases can we ignore the ideal elastic load distribution between fasteners and just divide the total shear load by the number of fasteners?”

I had the unusual situation of a large fitting with multiple fasteners (12 bolts) in the center of a composite part – some distance from any panel edge. Most composite panel bearing stresses are based on a failure mode related to the edge of the panel.

I have gathered some useful data here: https://www.abbottaerospace.com/aa-sb-001/12-joints/12-2-mechanically-fastened-joints/12-2-4-mechanical-joints-in-composite-panels/

This shows the typical non linear response of a fastener in an ultimate bearing failure situation (Ref: http://www.abbottaerospace.com/wpdm-package/afwl-tr-86-3035)

And the effect of edge distance on the bearing strength (https://www.abbottaerospace.com/wpdm-package/arc-cp-1380-the-strength-of-bolted-joints-in-multidirectional-cfrp-laminates

Should mean that in the center of panel we should see only bearing strength and the non linear nature of the bearing failure should give us some load redistribution between fasteners.

I got contacted by a good number of people publicly and privately (thanks to all of you!) and the consensus was that some redistribution would be reasonable in this situation.

I agree with this – especially as this is an arbitrary crash load case and is by nature a non service and conservative load condition.

This is for a foreign STC and so the opportunity to discuss with the relevant delegate is very limited (impossible!). So I will make sure this assumption is clear in the analysis and we will submit for review!

What do you think? Is this a reasonable assumption?

How to simplify Composite Stress Analysis

A version of this article first appeared in our free newsletter, to subscribe click here

I have been helping out a new client with setting up a composite analysis methodology for a prototype program.

The final client – the OEM – has not provided a methodology and has left it up to the sub-contractors to select their own analysis methods. This is not how we recommend to set up a composite program but this is how the OEM wants it for now.

We prefer the laminate strain analysis approach – there is a derivation of this method here:
https://www.abbottaerospace.com/aa-sb-001/4-materials/4-1-composite-materials/4-1-7-general-composite-laminate-analysis-approach/

However, there are some very simple analysis methods for composites that can be very successful in sizing and predicting the behaviour of aircraft structure.

There are European part 23 aircraft development and certification programs that use simple stress allowables for composite structure. There are different allowable stress values for Glass, Carbon, UD or Fabric. These values come out of the German glider industry and have proven to be reliable – within limits.

Clearly a simple laminate stress approach can work but it has to be within limits. The simpler the stress analysis method the greater the limitation on design features and conventions.

Similar to this a few years ago a north american client had developed an in-house stress based method for sizing their composite structures. As they generally only used quasi isotropic carbon cloth, they came up with a simple stress allowable for their laminate structures using the von mises stress tensor. More information on the von-mises stress envelope here: https://www.abbottaerospace.com/aa-sb-001/3-introduction/3-4-stress-analysis/3-4-2-combined-stresses/

Their derived laminate stress failure value was very close to the values used by the German Glider industry.

I ran a comparison for the von-mises stress envelope for their failure stress for quasi-isotropic laminate to the strain envelope that is typical for hot wet carbon laminate that we would use for analysis and this is what I found:

I would rate that as ‘not bad’ or even ‘not bad at all!”

So for quasi-isotropic laminate you can use a simple laminate stress allowable with a von-mises failure envelope. You have to be careful about biaxial compression but that is a relatively rare situation to encounter.

This company, by trial and error and possibly a bit of luck, had come up with an analysis method and failure criteria that was a very close match to our preferred certification analysis method. This was limited to quasi-isotropic fabric laminate only.

Interestingly if you compare to a traditional ply-by-ply failure method we also get close to a zero margin if we set up the laminate to a net stress of the same value.

You can use our standard spreadsheets to examine these different failure modes and envelopes:
https://www.abbottaerospace.com/downloads/aa-sm-041-020/
https://www.abbottaerospace.com/downloads/aa-sm-101-004/
https://www.abbottaerospace.com/downloads/aa-sm-101-008/

So, our new client has a range of options for potential analysis methods

Finite element models using this isotropic von-mises stress method are simple to create – you can use plate elements and equivalent isotropic materials – interpreting the results is easy as well – you can use the von mises stress tensor and a simple single check for strength. Similarly for hand analysis – you can reduce the overall analysis method to something similar to metallic structure analysis.

Of course….the problems start when you introduce core – although you can extend the method and regard the structure as a cored structure with isotopic sheets, using classical analysis methods for core panels.

And what to do about buckling……we have not run a comparison between a full laminate model in NASTRAN and the equivalent isotropic model for buckling solutions. I should look at that next.

Risk Management, Pandemics and Flight

A version of this article first appeared in the June 2020 edition of our free newsletter, to subscribe click here

One of the aspects of the recent crisis that has been clear to me is the poor risk management ability of our governing bodies.

One aspect of the data regarding the effects of COVID-19 that was consistent from the start was that it manifested the most serious symptoms in older and immune compromised people.

It is clear that most governments either did not understand that or understood it and failed to formulate policies that would be effective in protecting the most vulnerable.

So in order to put that in context let’s examine some figures. One good website for general data is https://www.worldometers.info/coronavirus/. Data should come with a warning that all data that you have not collected yourself should be regarded with a degree of skepticism. However, there are consistent trends of data from different data sets from which we can draw conclusions with reasonably high confidence.
I will not be able to show all of the data here but what I am showing is representative of overall trends within the entire data.

And note, within this data the margin of error is never qualified – misreporting, misdiagnosis, false test results, etc. I would recommend to ignore very low percentage values (<1%) as within the likely margin of error of the reporting methodology

Let’s look at some localized data samples

New York City:

(original data source: https://www1.nyc.gov/assets/doh/downloads/pdf/imm/covid-19-daily-data-summary-deaths-05132020-1.pdf)

The first thing to note is that at any age percentage of total death of people with no confirmed underlying condition is very, very low out of the total sample this is 99 / 15230 = 0.0065 or 0.65%.

Note that this is the percentage of people who have died out of all those who have died from COVID-19, not the risk of death – that is far, far lower. 

The number of confirmed cases in NYC on the 13th of may when this data was issued (Source: https://en.wikipedia.org/wiki/COVID-19_pandemic_in_New_York_City) = 189509

So out of all diagnosed cases (as of May 13) the risk of death of people confirmed to have no underlying condition was 99 / 189509 = 0.00052 or 0.052%

If you put this in terms of the total population on NYC (Source: https://en.wikipedia.org/wiki/New_York_City) = 8336817

So out of the population of NYC (as of May 13) the risk of death of people confirmed to have no underlying condition was 99 / 8336817 = 0.000012 or 0.0012%

To put this in context in NYC in 2019 there were 218 traffic fatalities (Source: https://abc7ny.com/traffic-fatalities-deaths-new-york-city/5802477/)

Twice as many as those confirmed not to have pre-existing conditions have died from COVID-19 than died in traffic accidents in NYC.

If you are healthy you face a greater risk when driving a car, riding a bike or crossing the road.

If we make the assumption that the NYC data is representative (I have reviewed other data sets and this data is generally similar to other reported data), what conclusions can we generally draw about how the virus affects the general population?

  • If you are ‘healthy’, regardless of your age, the illness appears to present no statistically significant elevated threat of death
  • If you are ‘not healthy’ regardless of your age the illness appears to present a statistically significant elevated threat of death.

In the context of these conclusions, does the strategy for mitigation of the effects of the virus adopted by most governments make sense?

To me, the answer to that question is easy. No.

We can see this by comparing the results of the different strategies from different governments

Comparing deaths per 1M of population (Source: https://www.worldometers.info/coronavirus/)

I took this data, brought it into Excel and removed all countries with populations less than 1M people. You can see from the data  that countries with small populations are overrepresented in the deaths per capita data. I regard these as statistical anomalies and have removed them. That phenomena is worthy of a closer look but that is not the purpose of this article.

With those countries removed the data looks like this:

Of these countries (with the exception of Ecuador, I have not examined the public policy at the time of writing) Sweden has not implemented significant restrictions on freedom to combat the spread of the virus. The rest of the countries in this group have implemented strict ‘lockdown’ policies. Sweden has adopted some mild mandatory restrictions but made most of the measures to combat the spread of the virus voluntary.

 What can we conclude from this?

From this one data point it appears there is no benefit to be gained between a strict, police enforced lockdown lasting for months and a voluntary social code of conduct.

If we take a step back, what ‘meta-lesson’ can we learn from this?

  • The perception of risk is more important than the actual risk
  • In formulating public policy the perception of risk is more important than data

This is an aspect of human nature called the precautionary principle. In the past, individuals used to be left to make their own precautionary and preventive risk decisions.

In recent years, governments have assumed the right to do this. Initially some good came out of this – traffic laws, vaccinations, etc.

If we examine public policy further we can also see something important, which is this:

The direct negative consequence of a precautionary public policy is ignored, and almost never reported, as long as the negative consequence is less than the most dramatic perceived risk.

It is also very hard to gather data on the negative consequence of government policy. It is not in the government’s interest to gather data on the failures of the policies they implement.

So how is this relevant to aircraft development?

I am working with a European EVTOL developer and we have spent some time going through the EASA special conditions for EVTOL aircraft.

There was a small change to the established regulations that caught my attention. (Source: https://www.easa.europa.eu/sites/default/files/dfu/SC-VTOL-01.pdf)

Can you spot it?

This is the same regulation in the new part 23 regulations:

And the equivalent from part 25:

The word ‘or’ has been inserted between the words detrimental and permanent.

Previously when qualifying aircraft structure, deformation had to be both permanent and detrimental to be disallowed. Now either detrimental deformations or permanent deformations are disallowed.

This raises two critical issues:

1: How do I show that any deformation is non detrimental? Any deformation could be associated with an eventual reduction in strength and therefore safety.

2: For metal structure there are many small scale, permanent, non detrimental deformations that occur at limit loads caused by local KT effects taking the metallic materials above the proportional limit. This rewording of the regulations implies that I have to take account of KT effects at limit level loads in static analysis of metallic structures.

If this new wording of the regulations is to stand, what effect will this have on the certification process for the applicant and what effect will it have on the aircraft product?

The results are relatively easy to predict.

Because this is a new requirement, it introduces uncertainty into the process. Uncertainty invariable creates delay and cost. The extent of the delay and additional cost is unknown. We can only hope that it will not be significant.

The only mitigation for this new standard is additional stiffness and a means to reduce stresses. This means additional weight.

There is no doubt that this new approach will increase safety. However, most changes to the regulations are initiated by a failure in service that informs a means to prevent that failure occurring again.

I know of no failure in service of a structure that complies with 23.2235, 23.305 or 25.305, and has been caused by an insufficient measure of safety inherent in the wording of that regulation.

A government employee has arbitrarily and unjustifiably applied the precautionary principle to a new set of aircraft regulations.

This change will increase cost and program time and will result in an aircraft product with lower performance. For an intangible, unnecessary and unquantifiable safety benefit.

Is the future for the industry a set of ever decreasing circles of unnecessary regulatory constraint and the resulting cost and performance negatives?

As with most safety issues the problems occur not because of a lack of appropriate standards in the written regulations. They occur because the regulatory process is circumvented or because of simple human error in the application of the existing standards.

Unless we analyse the shortcomings of the adoption of the precautionary principle at a governmental level, are we doomed to apply it at ever increasing levels?

What do you think? Has the government’s response to COVID-19 been good or bad? What have we learnt and how can we do things better in the future?

Are we creating a culture of mandating higher and higher levels of safety? What does this mean to the aircraft industry?