Sheet Metal Wire Gauge Sizes Table Chart

Weight and thickness of sheet metal, standard thickness of sheet metal and wire.

Material Specifications for Steel Sheet Metal:

A366: Cold Rolled Commercial Quality
A569: :Hot Rolled Commercial Quality
A570: Hot Rolled Structural Quality
A526: Zinc Coated (Galvanized) Steel
A526/A527: Galvanneal
A591: Electrolytically Zinc Plated

Fastener Thread Diameters and Installation Torques

Minimum (minor) and maximum (major)  thread diameters, threads per inch, tap size and drill sizes. ANSI External screw thread dimensions. Installation torque values from two different sources.

The data fastener thread pitch and diameter data below is taken, in part from,  from  MIL-S-8879

External screw thread dimensions from ANSI standard:

Bolt installation torques are taken from (NASA-RP-1228, 1990), (FAA-8083-30, 2008) and (MIL-HDBK-60, 1990)

The following chart is taken from (MIL-HDBK-60, 1990)

This table of recommended torque values is taken from (FAA-8083-30, 2008) chapter 5

There is a spreadsheet available with this data here

You can browse all of our spreadsheets here


Rivet Shear Strengths and Drill Sizes

Rivet Shear Strengths for common rivet materials, drill bit sizes and modification for sheet thickness


Rivet Shear Strengths are taken from  (MIL-HNDBK-5H, 1998) Table 8.1.2(a) and Table 8.1.2(b).

These strengths are the solid rivet shear strengths and describe the shear strength of the shank of the rivet. For the double shear strength of a rivet, the values in the table below can be doubled.

In calculating protruding-head rivet design shear strengths, the shear strength values obtained from Table 8.1.2(b) should be multiplied by the correction factors given in Table 8.1.2.1(b). This compensates for the reduction in rivet shear strength resulting from high bearing stresses on the rivet at t/D ratios less than 0.33 for single-shear joints and 0.67 for double-shear joints.

There is a spreadsheet available for this method here

You can browse all of our spreadsheets here

For more references on rivets in the Technical Library click here


Second Edition of our Free Textbook Now Released

We are very happy to announce that the second edition of our free engineering textbook “Analysis and Design of Composite and Metallic Flight Vehicle Structures” is now available.

We have also added many new free spreadsheets to our collection and now have over 200 free spreadsheets available to complement the textbook available in the Technical Library.  We have added many new references to the book and the library and are working hard to provide best tools and references available to structures engineers at no cost.

If you want to help, there are several different ways you can support our efforts:

  1. Consider using our engineering services for your project. We are engaged with many aircraft OEMs in many roles: Structures group leadership, Stress Analysis, Structures and Mechanical System Design, Certification Planning, Methodology definition and Test Planning and Conduct. If you like our tools you will like our engineering services.
  2. You can purchase a license for XL-Viking. We developed our Excel Add-in specifically to help engineers write and check analyses. All of our free spreadsheets use the add-in to display math. Join WS Atkins and Piper Aircraft and add XL-Viking to your software tool chest. Ensure your excel files are more accurate and display your math effortlessly.
  3. Or you can donate via Paypal or Patreon to help us develop and improve the technical library and expand the content we make available for free.

Improvements to the textbook since the first edition:

  • Stress Tensor  and Shear Stress distribution Sections now included

Textbook - Stress Tensor  and Shear Stress distribution Sections

  • Comprehensive section properties including First Moment of Area and Cozzone Shape Factor

Textbook - section properties

  • Simple Beam Equations for over 30 type of Beams

Textbook - Beam Equations

  • Over 50 brand new Free Spreadsheets linked to the Text
  • Hundreds of improvements, additions and refinements – Sections covering the use of Microsoft Excel for engineers, Improved pull through strength for composite laminates, additional guidelines for analysis of welded joints, additional of quick search links for our technical library.

This makes the textbook closer to the “one stop shop” that we always wanted it to be. Additional to future editions will include Torsion Analysis, Post-buckling, Plates under Pressure and much more.


Estimation of Material Shape Factor in the Plastic Range

This method is taken from our free textbook “Analysis and Design of Composite & Metallic Flight Vehicle Structures” and gives a way to calculate the shape factor in the plastic range for a ductile material.

The Ramberg-Osgood Stress-Strain Curve Shape Factor in the yielding region (NACA-TN-902, 1943) can be found for most common ductile materials from  (MIL-HNDBK-5H, 1998). A more easily used adaption of the Ramberg-Osgood stress-strain curve is given in (NACA-TN-927, 1944):

Simplified Ramberg Osgood Equation

This caveat is given in (MIL-HNDBK-5H, 1998) with regard to the Ramberg-Osgood approximation:

“While this relationship may not be exact, it is sufficiently accurate for use up to the yield strength for many materials, but cannot be employed to compute full-range stress-strain curves.”

(MIL-HNDBK-5H, 1998) does give a method for computing the shape factor in the plastic range of the stress-strain curve:

Shape Factor in the Plastic Range

Using the law of natural logs over the full plastic range of the curve the expression for ‘n’ can be expressed as:

This shape factor can be used to change the shape of the curve above the material yield stress to make the curve more representative of the actual material behavior.

This shape factor ‘n’ in the plastic range is usually significantly different to the material ‘n’ for the material in the yielding region of the stress-strain curve.

The enhancement to the Ramberg-Osgood method is used in our full range material data curve spreadsheet.

(Post Updated for Clarity and SEO 8 March 2017)

Stresses Due to Interference Fit Bushings

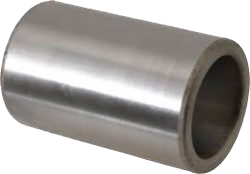
This post is taken from our free textbook “Analysis and Design of Composite & Metallic Flight Vehicle Structures” and defines a method for calculating the stresses due to an interference fit bushing.

The method in this section is referenced to (AFFDL-TR-69-42, 1986) Section 9.16. Note that several errors in the source material have been corrected. The expression for the maximum tangential stress for the bushing: The ‘p’ and ‘B’ should be in regular font, therefore the numerator becomes ‘2pB2’ and the denominator of this expression should read ‘B2-A2’.

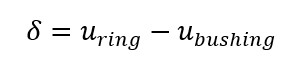
The pressure between a lug and a bushing assembly having negative clearance can be determined by consideration of the radial displacements. This method assumes the lug acts as if it is a uniform ring around the interference fit bushing. After assembly, the increase in the inner radius of the ring (lug), plus the decrease in the outer radius of the bushing equals the difference between the radii of the bushing and ring (lug) before assembly.

Where:

δ                Difference between outer radius of bushing and inner radius of the ring

u                Radial displacement, positive away from the axis of the ring or bushing

Radial displacement at the inner surface of a ring subjected to internal pressure p is:

Radial displacement at the inner surface of a ring

Radial displacement at the outer surface of an interference fit bushing subjected to external pressure p is:

Radial displacement at the outer surface of a bushing

Where:

A                Inner radius of bushing, in

B               Outer radius of bushing, in

C                Outer radius of ring, in (lug)

D               Inner radius of ring, in (lug)

E               Modulus of elasticity, psi

μ                Poisson’s ratio


Combining these equations and substituting into the first equation and solving for p gives the following expression:

Combining these equations

Maximum radial and tangential stresses for a ring (lug) subjected to internal pressure occur at the inner surface of the ring (lug).

Maximum radial stress for lug (the pressure on the interface between the lug and the bushing):

Maximum radial stress for lug

Maximum tangential stress for lug:

Maximum tangential stress for lug

Positive sign indicates tension. The maximum shear stress at this point in the lug is:

The maximum shear stress

The maximum radial stress for a bushing subjected to external pressure occurs at the outer surface of the bushing and is:

The maximum radial stress for a bushing

The maximum tangential stress for a bushing subjected to external pressure occurs at the inner surface of the bushing and is:

The maximum tangential stress for a bushing

Acceptable stress levels:

  • Stress corrosion. This maximum allowable press fit stress in magnesium alloys should not exceed 8000psi. For all aluminum alloys, the maximum press fit stress should not exceed 0.50Fty.
  • Static fatigue. For steels heat treated to above 200ksi, where there is any risk of hydrogen embrittlement the press fit stress should not exceed 0.25Ftu.
  • Ultimate strength. Ftu should not be exceeded. However, it is rare to create stresses of this magnitude in a press fit bushing installation.

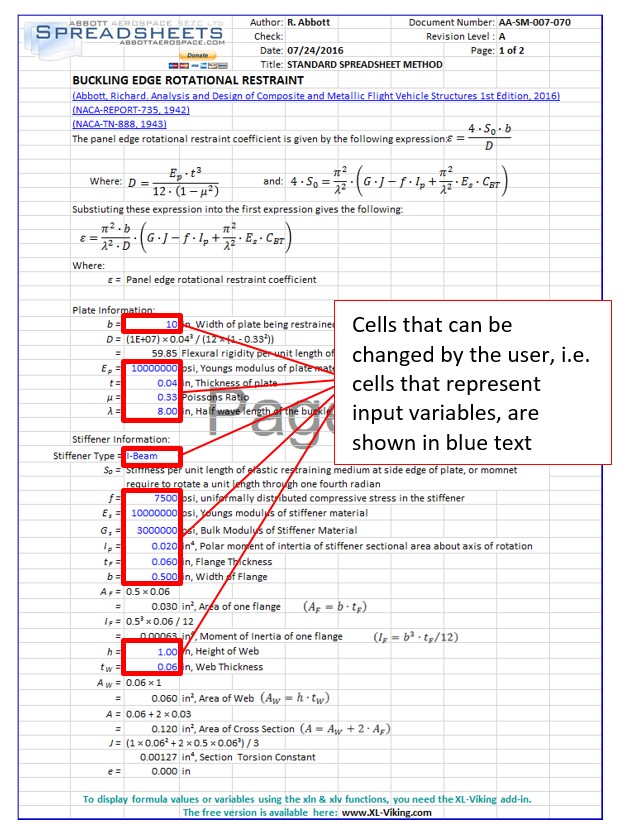
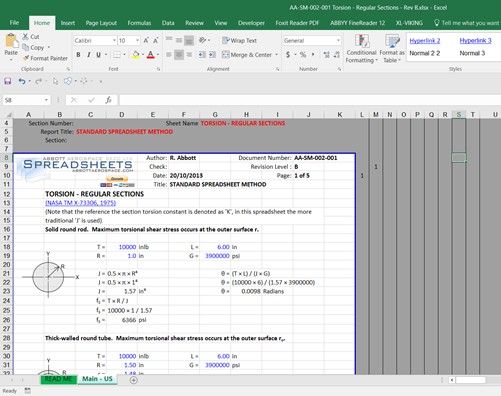
 A free spreadsheet for this method is available at this link

All of our free spreadsheets are available here

Using Microsoft Excel as a Analysis and Report Tool – Post 4

Excel as a Reporting Tool – Part 4, The First 3 Rules

Excel as a Reporting Tool – Introduction – Part 1 here

Excel as a Reporting Tool – The Basics – Part 2 here

Excel as a Reporting Tool – Printing, Columns and Rules – Part 3 here

In the previous post we outlined the basic rules that we use to govern the use of Excel as a report writing tools, in this post we give clear definition and guidance on the first 3 rules.

Cell Text Color Rule and Managing Input Data

It is important that you track which cells have input data that is typed in. This is for two reasons.

  1. In a large report, up to hundreds pf pages long, it is easy to forget which cells contain raw data and which cells reference other cells. When it comes time to make changes or updates to the reports it is important to know which cells should be manually updated with the change in the analysis parameters
  2. When you pass the report on to your client or co-worker they also should know which cells have to be manually updated.

To get the most out of Excel as a report writing tool the author and the reader have to know what parts of the report are raw data and what parts are linked to the raw data.

For some reports, we will import finite element model output into one sheet, process it in another and write the report in a separate sheet. If the finite element model output data is kept in native format, updated runs of the finite element model can be written over the existing data and the report can update to the new input values automatically. (with some judicious checking to ensure nothing went wrong along the way)

This kind of approach takes some forethought and careful arranging of how the imported finite element model output data is searched by the spreadsheet (using the INDEX and MATCH functions). When it is done properly is can save hours or days of time when inevitable loads or design updates occur.

We only use blue text to denote inputs on the pages of the report section of the workbook.

Example of Blue Input Cells for Analysis Spreadsheet:

Page Header (and Footer) Rule

We use the first few rows at the top of each page to create the page header

Page Header Definition:

The page header can be formatted to suit any company report standard. Care must be taken to preserve this region of each page. It can easily be reconstituted by copying from an intact example, but it is good practice to consider this region of the page ‘out of bounds’.

For our in-house templates we do not use a page footer. On the standard analysis spreadsheets on the site we do have the footer advertisement for XL-Viking, but this is an extra page element to manage so we avoid this where we can.

If you avoid the use of a footer on the work sheet then you can terminate pages early without having the footer change its position – a footer shown on the spreadsheet page will change position with the length of the page.

Analysis off the Page Rule

The art of creating a good report is to show only what you need to on the page of the report – and to show that information appropriately referenced and to the correct level of detail.

The area off to the right of the page is a region where you can place the guts of the analysis if it is not appropriate to show it on the page of the report. The area off to the right of the printed report page can be used as an area for rough calculations, to store a picture or scanned reference as a reminder or to place hyperlinks to on-line references. It can also be used to pass on notes to other people using the spreadsheet.


Analysis Sheet Example Showing Data off the Printed Area of the Page:

However, the cardinal rule is to keep all of the off-page work in line with the analysis shown on the page. This makes it possible to copy a complete discrete analysis, all the working out and all of the references by copying complete rows to another place in the report, or into another report/excel workbook file.

More rules in the next post……..

Using Microsoft Excel as a Analysis and Report Tool – Post 3

Excel as a Reporting Tool – Part 3, Printing, Columns and Rules

Excel as a Reporting Tool – Introduction – Part 1 here

Excel as a Reporting Tool – The Basics – Part 2 here

Excel does not cope well with different printers and adapting page breaks and scaling from one printer to another. An important rule to adopt is to set up all your report spreadsheets printer to ‘Microsoft Print to PDF’. This is done in the file menu. Select print from the menu on the left hand side.

It is best to avoid printing your report directly from excel to a printer. It is better to create a .pdf file and then print the .pdf file.

Changing your Printer to ‘Microsoft Print to PDF’:

Column width should be set so that, using the font and the size of font that works for your report you can display large numbers in individual cells.

The body text of our reports is 10 point Calibri and we base our page width on 11 columns. Each column is 81 pixels wide and an individual cell can display numbers up to 8 digits long.

Abbott Aerospace Standard Column Sizing and Arrangement:

Note that numeric values will not spread over to the neighboring cells like text does. A numeric value must fit all in a single cell. If this is not possible you can merge cells to display numbers with higher character counts.

In the figure above you can see that to the right of the print area there are several columns that are narrower and marked with vertical border lines.

We use these columns to create figure and section numbering similar to Microsoft word.

We also reserve the first few rows of the sheet to contain sheet or document data. Note that both of these regions – the columns to the left of the page and the rows above the page – are not printed and are only visible to the analyst who is using the spreadsheet to create the report.

Other rules that we follow:

  1. Cell text color rule: All cells that contain numerical input data for the analysis in the sheet have blue text. This way everyone who uses the spreadsheet knows what cells are ‘input’ values.
  2. Page Header Rule: The top 4 or 5 rows of your page is the page header and contains the company information, report, subsection and page numbering information.
  3. Analysis off the page Rule: The non-displayed analysis for each page is kept within the same rows as the page.
  4. Column widths Rule: If you need to display data too large for your column width, merge cells across multiple columns.
  5. Do not use Visual Basic: Visual basic is not recommended for use in report spreadsheets. This will be explained later on.
  6. Do not use Named Ranges: Names ranges in excel cause problems when copying sections between reports, duplicating sheets within a report and copying from standard methods into reports. We have ceased use of all named ranges. See later section for workarounds.
  7. Avoid Using the Solver: Any process that must be triggered by the user that they cannot be intuitively aware of should be avoided. The Solver is the most common function within excel that behaves like this.

More on rules in the next post……..

Using Microsoft Excel as a Analysis and Report Tool – Post 2

Excel as a Reporting Tool – Part 2 – The Basics – Part 1 here

Choosing your Font

Font selection is important. It is important to select a font that looks clear on the screen and when printed out. It is preferable to select a font that is part of the windows native font package so it need not be specially installed by everyone who wants to use your file. The font must be fully populated with the extended character set (more on this later). The font must have minimal scaling problems with Excel’s display when you use different magnification levels.

We have settled on using Calibri and have been using it for the last 5 years and I am very happy with it. The textbook is written in Calibri and it is a clean, san-serif font that looks good in bold and italic.

We have developed a custom font that is part of the XL-Viking package. This font is given away for free without having to make any purchase. We have populated this font with a set of superscript and subscript characters in the native font format that are not usually available.

It is important that attention is paid to the little things. Legibility, transferability and clarity are all key aspects of a technical report.

Page Break Preview and Print Area

Excel was created without consideration for authoring Letter or A4 page size reports in mind. Nevertheless, there are some useful tools built in that help you do this

Excel When First Started:

The figure above is what you see when you start excel, in the lower RH corner are 3 Icons.

Page Layout Icons:

For the report sheets (More on the use of sheets later) we only work in Page Break Preview.

If you click that icon your screen will change and will look like this:

Excel Startup Page Break Preview:

All the cells are ‘greyed-out’. This is because there is no defined Print Area. In order to define a Print Area, select a range of cells and go to the Page layout menu.

Selecting Cells to Define a Print Area:

And click on the Print Area button:

Print Area Button:

And click ‘Set Print Area’. The screen will now look like this

Print Area Defined:

When Excel is used in this way only the area in the while cells is printed. All of the grey area is not printed. When the term ‘Printed’ is used it also applies to the creation of pdf files. When a pdf file is created, the pdf will only show the ‘print area’ of the page.

This is very useful and allows you to display only the results of an analysis on the printed part of the report. We use this concept extensively in many of our standard spreadsheets. The way you arrange and use your analysis within this framework is a key aspect of using Excel and is covered in the next section.

Continued in the next post……..