
Excel as a Reporting Tool – Part 3, Printing, Columns and Rules
Excel as a Reporting Tool – Introduction – Part 1 here
Excel as a Reporting Tool – The Basics – Part 2 here
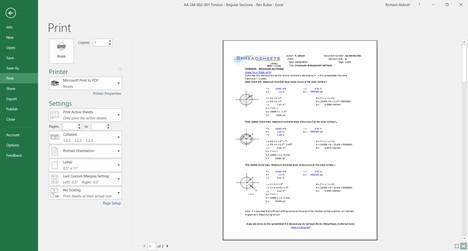
Excel does not cope well with different printers and adapting page breaks and scaling from one printer to another. An important rule to adopt is to set up all your report spreadsheets printer to ‘Microsoft Print to PDF’. This is done in the file menu. Select print from the menu on the left hand side.
It is best to avoid printing your report directly from excel to a printer. It is better to create a .pdf file and then print the .pdf file.
Changing your Printer to ‘Microsoft Print to PDF’:
Column width should be set so that, using the font and the size of font that works for your report you can display large numbers in individual cells.
The body text of our reports is 10 point Calibri and we base our page width on 11 columns. Each column is 81 pixels wide and an individual cell can display numbers up to 8 digits long.
Abbott Aerospace Standard Column Sizing and Arrangement:
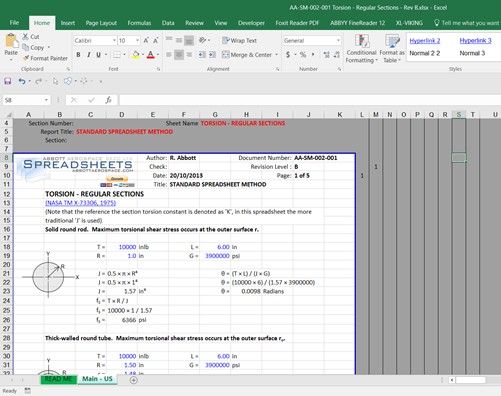
Note that numeric values will not spread over to the neighboring cells like text does. A numeric value must fit all in a single cell. If this is not possible you can merge cells to display numbers with higher character counts.
In the figure above you can see that to the right of the print area there are several columns that are narrower and marked with vertical border lines.
We use these columns to create figure and section numbering similar to Microsoft word.
We also reserve the first few rows of the sheet to contain sheet or document data. Note that both of these regions – the columns to the left of the page and the rows above the page – are not printed and are only visible to the analyst who is using the spreadsheet to create the report.
Other rules that we follow:
- Cell text color rule: All cells that contain numerical input data for the analysis in the sheet have blue text. This way everyone who uses the spreadsheet knows what cells are ‘input’ values.
- Page Header Rule: The top 4 or 5 rows of your page is the page header and contains the company information, report, subsection and page numbering information.
- Analysis off the page Rule: The non-displayed analysis for each page is kept within the same rows as the page.
- Column widths Rule: If you need to display data too large for your column width, merge cells across multiple columns.
- Do not use Visual Basic: Visual basic is not recommended for use in report spreadsheets. This will be explained later on.
- Do not use Named Ranges: Names ranges in excel cause problems when copying sections between reports, duplicating sheets within a report and copying from standard methods into reports. We have ceased use of all named ranges. See later section for workarounds.
- Avoid Using the Solver: Any process that must be triggered by the user that they cannot be intuitively aware of should be avoided. The Solver is the most common function within excel that behaves like this.
Comment On This Post