
Excel as a Reporting Tool – Part 4, The First 3 Rules
Excel as a Reporting Tool – Introduction – Part 1 here
Excel as a Reporting Tool – The Basics – Part 2 here
Excel as a Reporting Tool – Printing, Columns and Rules – Part 3 here
In the previous post we outlined the basic rules that we use to govern the use of Excel as a report writing tools, in this post we give clear definition and guidance on the first 3 rules.
Cell Text Color Rule and Managing Input Data
It is important that you track which cells have input data that is typed in. This is for two reasons.
- In a large report, up to hundreds pf pages long, it is easy to forget which cells contain raw data and which cells reference other cells. When it comes time to make changes or updates to the reports it is important to know which cells should be manually updated with the change in the analysis parameters
- When you pass the report on to your client or co-worker they also should know which cells have to be manually updated.
To get the most out of Excel as a report writing tool the author and the reader have to know what parts of the report are raw data and what parts are linked to the raw data.
For some reports, we will import finite element model output into one sheet, process it in another and write the report in a separate sheet. If the finite element model output data is kept in native format, updated runs of the finite element model can be written over the existing data and the report can update to the new input values automatically. (with some judicious checking to ensure nothing went wrong along the way)
This kind of approach takes some forethought and careful arranging of how the imported finite element model output data is searched by the spreadsheet (using the INDEX and MATCH functions). When it is done properly is can save hours or days of time when inevitable loads or design updates occur.
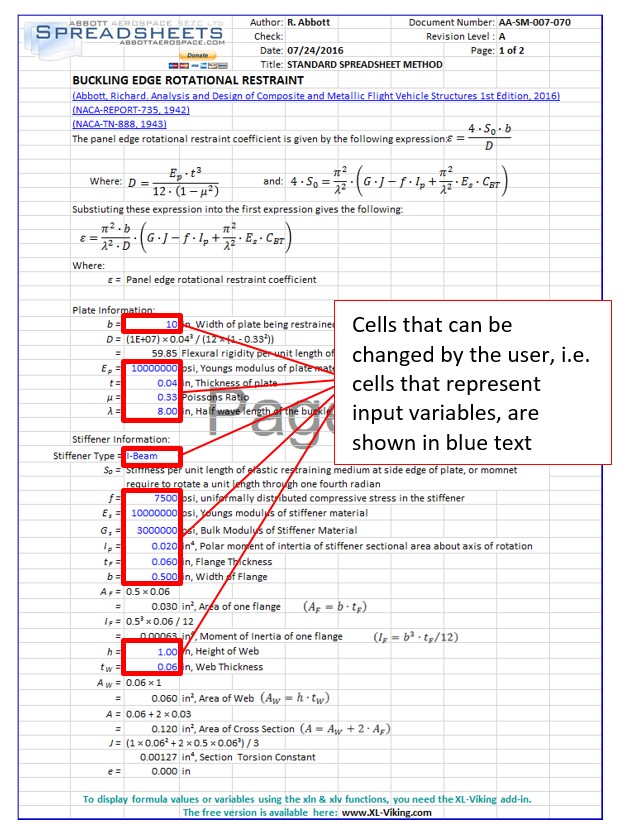
We only use blue text to denote inputs on the pages of the report section of the workbook.
Example of Blue Input Cells for Analysis Spreadsheet:
Page Header (and Footer) Rule
We use the first few rows at the top of each page to create the page header
Page Header Definition:
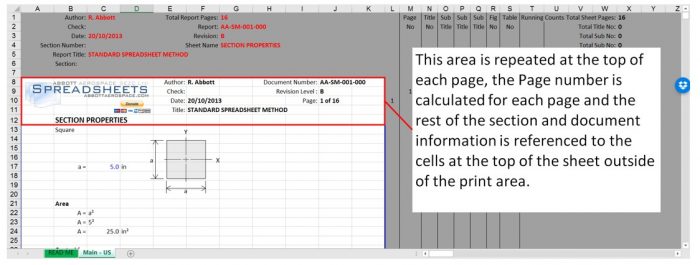
The page header can be formatted to suit any company report standard. Care must be taken to preserve this region of each page. It can easily be reconstituted by copying from an intact example, but it is good practice to consider this region of the page ‘out of bounds’.
For our in-house templates we do not use a page footer. On the standard analysis spreadsheets on the site we do have the footer advertisement for XL-Viking, but this is an extra page element to manage so we avoid this where we can.
If you avoid the use of a footer on the work sheet then you can terminate pages early without having the footer change its position – a footer shown on the spreadsheet page will change position with the length of the page.
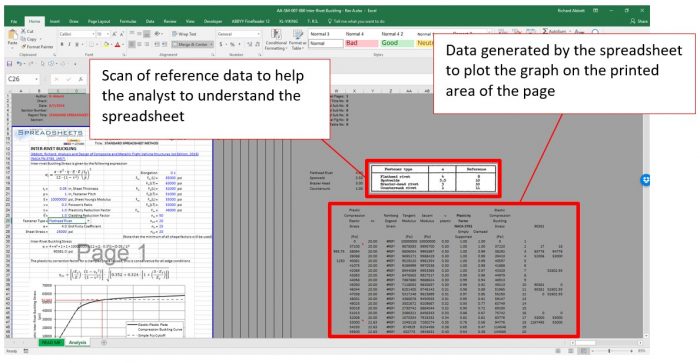
Analysis off the Page Rule
The art of creating a good report is to show only what you need to on the page of the report – and to show that information appropriately referenced and to the correct level of detail.
The area off to the right of the page is a region where you can place the guts of the analysis if it is not appropriate to show it on the page of the report. The area off to the right of the printed report page can be used as an area for rough calculations, to store a picture or scanned reference as a reminder or to place hyperlinks to on-line references. It can also be used to pass on notes to other people using the spreadsheet.
Analysis Sheet Example Showing Data off the Printed Area of the Page:
However, the cardinal rule is to keep all of the off-page work in line with the analysis shown on the page. This makes it possible to copy a complete discrete analysis, all the working out and all of the references by copying complete rows to another place in the report, or into another report/excel workbook file.
More rules in the next post……..
Comment On This Post