Excel as a Reporting Tool – Part 2 – The Basics – Part 1 here
Choosing your Font
Font selection is important. It is important to select a font that looks clear on the screen and when printed out. It is preferable to select a font that is part of the windows native font package so it need not be specially installed by everyone who wants to use your file. The font must be fully populated with the extended character set (more on this later). The font must have minimal scaling problems with Excel’s display when you use different magnification levels.
We have settled on using Calibri and have been using it for the last 5 years and I am very happy with it. The textbook is written in Calibri and it is a clean, san-serif font that looks good in bold and italic.
We have developed a custom font that is part of the XL-Viking package. This font is given away for free without having to make any purchase. We have populated this font with a set of superscript and subscript characters in the native font format that are not usually available.
It is important that attention is paid to the little things. Legibility, transferability and clarity are all key aspects of a technical report.
Page Break Preview and Print Area
Excel was created without consideration for authoring Letter or A4 page size reports in mind. Nevertheless, there are some useful tools built in that help you do this
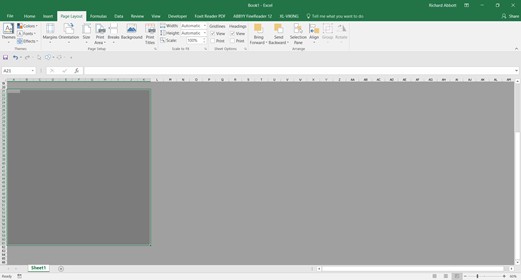
Excel When First Started:
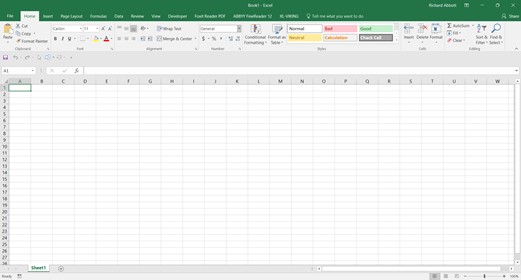
The figure above is what you see when you start excel, in the lower RH corner are 3 Icons.
Page Layout Icons:
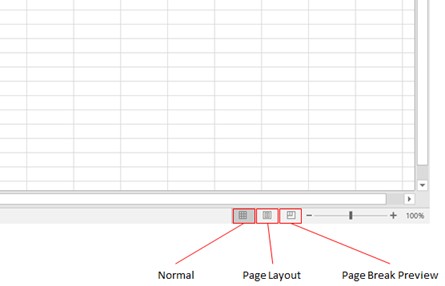
For the report sheets (More on the use of sheets later) we only work in Page Break Preview.
If you click that icon your screen will change and will look like this:
Excel Startup Page Break Preview:
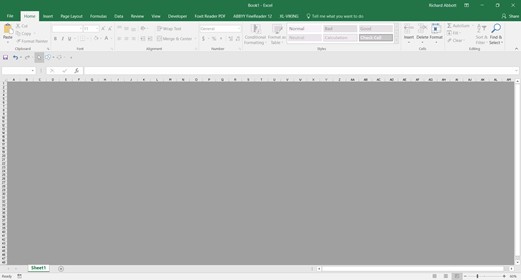
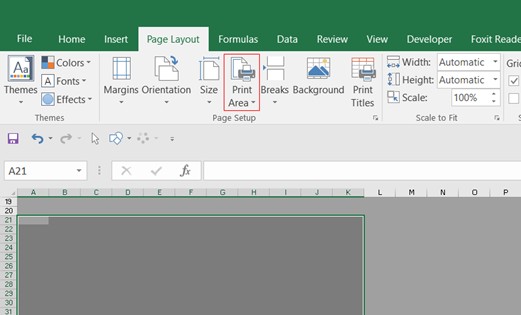
All the cells are ‘greyed-out’. This is because there is no defined Print Area. In order to define a Print Area, select a range of cells and go to the Page layout menu.
Selecting Cells to Define a Print Area:
And click on the Print Area button:
Print Area Button:
And click ‘Set Print Area’. The screen will now look like this
Print Area Defined:
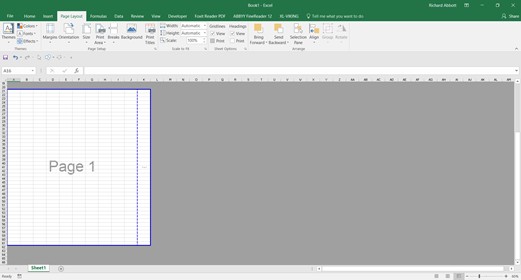
When Excel is used in this way only the area in the while cells is printed. All of the grey area is not printed. When the term ‘Printed’ is used it also applies to the creation of pdf files. When a pdf file is created, the pdf will only show the ‘print area’ of the page.
This is very useful and allows you to display only the results of an analysis on the printed part of the report. We use this concept extensively in many of our standard spreadsheets. The way you arrange and use your analysis within this framework is a key aspect of using Excel and is covered in the next section.
Continued in the next post……..
We love Calibri too. It’s a “cleartype” font (https://en.wikipedia.org/wiki/ClearType) optimized for viewing on LCD monitors. Easy to read in any format for a sans serif. In fact, we use it for our engineering drawings too!
Great minds think alike…..or at least gravitate towards the obvious!