This method is taken from our free textbook “Analysis and Design of Composite & Metallic Flight Vehicle Structures” and gives a way to calculate the shape factor in the plastic range for a ductile material.
The Ramberg-Osgood Stress-Strain Curve Shape Factor in the yielding region (NACA-TN-902, 1943) can be found for most common ductile materials from (MIL-HNDBK-5H, 1998). A more easily used adaption of the Ramberg-Osgood stress-strain curve is given in (NACA-TN-927, 1944):

This caveat is given in (MIL-HNDBK-5H, 1998) with regard to the Ramberg-Osgood approximation:
“While this relationship may not be exact, it is sufficiently accurate for use up to the yield strength for many materials, but cannot be employed to compute full-range stress-strain curves.”
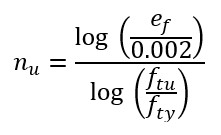
(MIL-HNDBK-5H, 1998) does give a method for computing the shape factor in the plastic range of the stress-strain curve:

Using the law of natural logs over the full plastic range of the curve the expression for ‘n’ can be expressed as:
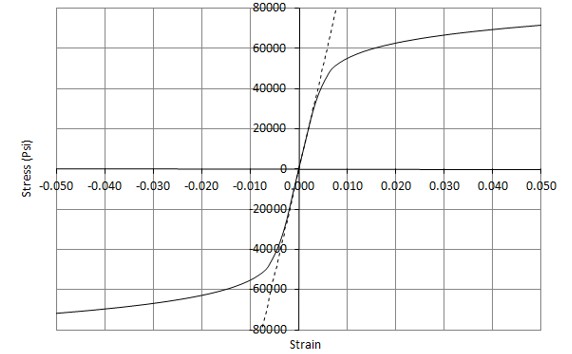
This shape factor can be used to change the shape of the curve above the material yield stress to make the curve more representative of the actual material behavior.
This shape factor ‘n’ in the plastic range is usually significantly different to the material ‘n’ for the material in the yielding region of the stress-strain curve.
The enhancement to the Ramberg-Osgood method is used in our full range material data curve spreadsheet.
(Post Updated for Clarity and SEO 8 March 2017)
Hi Richard. Don’t material tables list e_f as elongation at fracture? As such, e_f may not correspond with F_tu, but to fracture stress, which may be lower than F_tu for most materials…
You may be right if the ultimate tensile strength does not occur ar the point of fracture – Mil-Hndbk-5 sections 1.4.4.5 and 1.4.4.6 give definition of Ultimate Tensile Stress and Elongation.
There is a good comparison between ‘true’ and ‘engineering’ stress-strain curves given here http://www.totalmateria.com/page.aspx?ID=CheckArticle&site=kts&NM=42. My understanding is that the Ftu data is the peak strength from the ‘engineering’ curve (see figure 1.4.4.1) and the elongation is the strain at fracture after plasticity and necking – The ‘True’ strain.
Constructing an analysis stress-strain curve using the ‘true’ strain and ‘engineering’ Ftu assumes that no useful load carrying capacity is available after the engineering Ftu is reached and I think is conservative in all circumstances – what do you think?